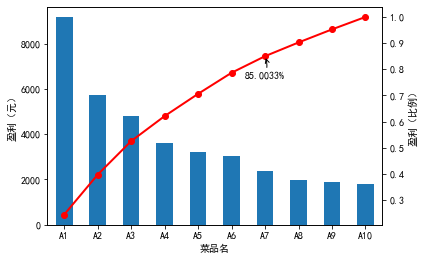
#-*- coding: utf-8 -*-#菜品盈利数据 帕累托图from __future__ import print_functionimport pandas as pd#初始化参数dish_profit = '../data/catering_dish_profit.xls' #餐饮菜品盈利数据data = pd.read_excel(dish_profit, index_col = u'菜品名')data = data[u'盈利'].copy()# data.sort(ascending = False)# AttributeError: 'Series' object has no attribute 'sort'data.sort_index(ascending = False) # 版本问题import matplotlib.pyplot as plt #导入图像库plt.rcParams['font.sans-serif'] = ['SimHei'] #用来正常显示中文标签plt.rcParams['axes.unicode_minus'] = False #用来正常显示负号plt.figure()data.plot(kind='bar')plt.ylabel(u'盈利(元)')p = 1.0*data.cumsum()/data.sum()p.plot(color = 'r', secondary_y = True, style = '-o',linewidth = 2)plt.annotate(format(p[6], '.4%'), xy = (6, p[6]), xytext=(6*0.9, p[6]*0.9),arrowprops=dict(arrowstyle="->", connectionstyle="arc3,rad=.2")) #添加注释,即85%处的标记。这里包括了指定箭头样式。plt.ylabel(u'盈利(比例)')plt.show()

若有收获,就点个赞吧
0 人点赞
