多光标
同时在多个图上显示光标。
此示例生成两个子图,并将光标悬停在一个子图中的数据上,该数据点的值分别显示在两个子图中。
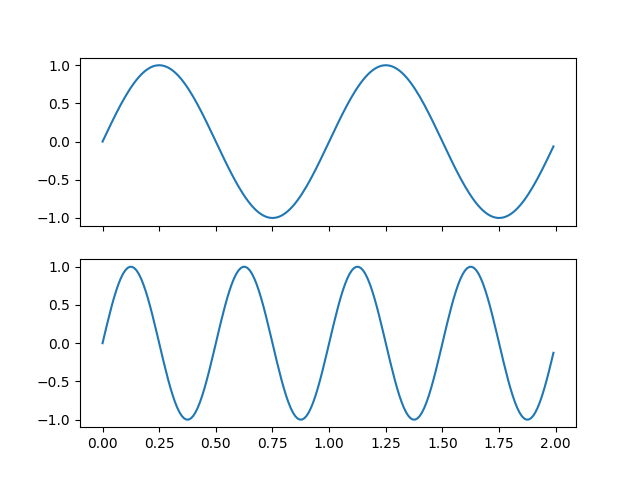
import numpy as npimport matplotlib.pyplot as pltfrom matplotlib.widgets import MultiCursort = np.arange(0.0, 2.0, 0.01)s1 = np.sin(2*np.pi*t)s2 = np.sin(4*np.pi*t)fig, (ax1, ax2) = plt.subplots(2, sharex=True)ax1.plot(t, s1)ax2.plot(t, s2)multi = MultiCursor(fig.canvas, (ax1, ax2), color='r', lw=1)plt.show()
下载这个示例

若有收获,就点个赞吧
0 人点赞
