等轴比演示
如何设置和调整具有等轴比的图像。
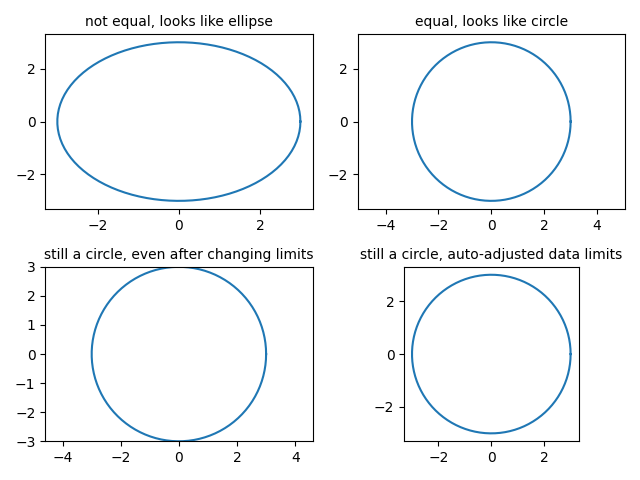
import matplotlib.pyplot as pltimport numpy as np# Plot circle of radius 3.an = np.linspace(0, 2 * np.pi, 100)fig, axs = plt.subplots(2, 2)axs[0, 0].plot(3 * np.cos(an), 3 * np.sin(an))axs[0, 0].set_title('not equal, looks like ellipse', fontsize=10)axs[0, 1].plot(3 * np.cos(an), 3 * np.sin(an))axs[0, 1].axis('equal')axs[0, 1].set_title('equal, looks like circle', fontsize=10)axs[1, 0].plot(3 * np.cos(an), 3 * np.sin(an))axs[1, 0].axis('equal')axs[1, 0].axis([-3, 3, -3, 3])axs[1, 0].set_title('still a circle, even after changing limits', fontsize=10)axs[1, 1].plot(3 * np.cos(an), 3 * np.sin(an))axs[1, 1].set_aspect('equal', 'box')axs[1, 1].set_title('still a circle, auto-adjusted data limits', fontsize=10)fig.tight_layout()plt.show()
下载这个示例

若有收获,就点个赞吧
0 人点赞
