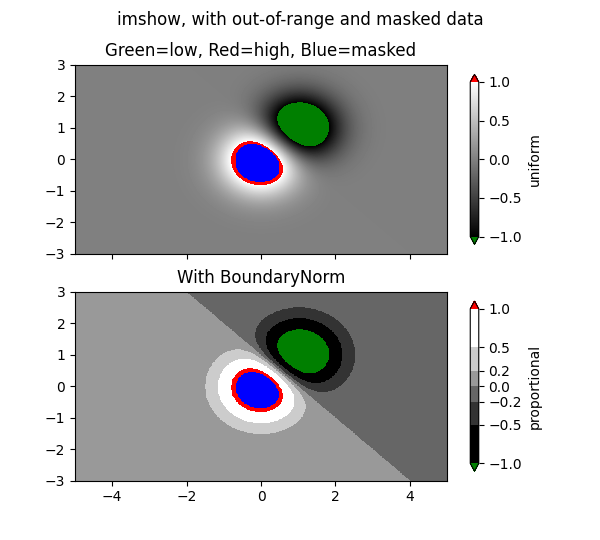
图像掩码
显示与掩码数组输入和范围以外的颜色。
第二个子图说明了如何使用边界规范来获得填充轮廓效果。
from copy import copyimport numpy as npimport matplotlib.pyplot as pltimport matplotlib.colors as colors# compute some interesting datax0, x1 = -5, 5y0, y1 = -3, 3x = np.linspace(x0, x1, 500)y = np.linspace(y0, y1, 500)X, Y = np.meshgrid(x, y)Z1 = np.exp(-X**2 - Y**2)Z2 = np.exp(-(X - 1)**2 - (Y - 1)**2)Z = (Z1 - Z2) * 2# Set up a colormap:# use copy so that we do not mutate the global colormap instancepalette = copy(plt.cm.gray)palette.set_over('r', 1.0)palette.set_under('g', 1.0)palette.set_bad('b', 1.0)# Alternatively, we could use# palette.set_bad(alpha = 0.0)# to make the bad region transparent. This is the default.# If you comment out all the palette.set* lines, you will see# all the defaults; under and over will be colored with the# first and last colors in the palette, respectively.Zm = np.ma.masked_where(Z > 1.2, Z)# By setting vmin and vmax in the norm, we establish the# range to which the regular palette color scale is applied.# Anything above that range is colored based on palette.set_over, etc.# set up the Axes objetsfig, (ax1, ax2) = plt.subplots(nrows=2, figsize=(6, 5.4))# plot using 'continuous' color mapim = ax1.imshow(Zm, interpolation='bilinear',cmap=palette,norm=colors.Normalize(vmin=-1.0, vmax=1.0),aspect='auto',origin='lower',extent=[x0, x1, y0, y1])ax1.set_title('Green=low, Red=high, Blue=masked')cbar = fig.colorbar(im, extend='both', shrink=0.9, ax=ax1)cbar.set_label('uniform')for ticklabel in ax1.xaxis.get_ticklabels():ticklabel.set_visible(False)# Plot using a small number of colors, with unevenly spaced boundaries.im = ax2.imshow(Zm, interpolation='nearest',cmap=palette,norm=colors.BoundaryNorm([-1, -0.5, -0.2, 0, 0.2, 0.5, 1],ncolors=palette.N),aspect='auto',origin='lower',extent=[x0, x1, y0, y1])ax2.set_title('With BoundaryNorm')cbar = fig.colorbar(im, extend='both', spacing='proportional',shrink=0.9, ax=ax2)cbar.set_label('proportional')fig.suptitle('imshow, with out-of-range and masked data')plt.show()
参考
下面的示例演示了以下函数和方法的使用:
import matplotlibmatplotlib.axes.Axes.imshowmatplotlib.pyplot.imshowmatplotlib.figure.Figure.colorbarmatplotlib.pyplot.colorbarmatplotlib.colors.BoundaryNormmatplotlib.colorbar.ColorbarBase.set_label
下载这个示例

若有收获,就点个赞吧
0 人点赞
