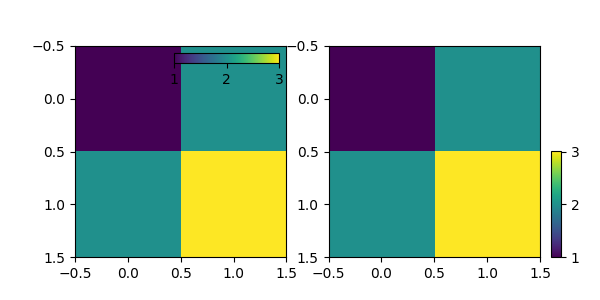
使用插入定位器演示Colorbar

import matplotlib.pyplot as pltfrom mpl_toolkits.axes_grid1.inset_locator import inset_axesfig, (ax1, ax2) = plt.subplots(1, 2, figsize=[6, 3])axins1 = inset_axes(ax1, width="50%", # width = 10% of parent_bbox width height="5%", # height : 50% loc='upper right')im1 = ax1.imshow([[1, 2], [2, 3]])plt.colorbar(im1, cax=axins1, orientation="horizontal", ticks=[1, 2, 3])axins1.xaxis.set_ticks_position("bottom")axins = inset_axes(ax2, width="5%", # width = 10% of parent_bbox width height="50%", # height : 50% loc='lower left', bbox_to_anchor=(1.05, 0., 1, 1), bbox_transform=ax2.transAxes, borderpad=0, )# Controlling the placement of the inset axes is basically same as that# of the legend. you may want to play with the borderpad value and# the bbox_to_anchor coordinate.im = ax2.imshow([[1, 2], [2, 3]])plt.colorbar(im, cax=axins, ticks=[1, 2, 3])plt.show()
下载这个示例


