比例尺
说明应用于轴的比例变换,例如: log,symlog,logit。
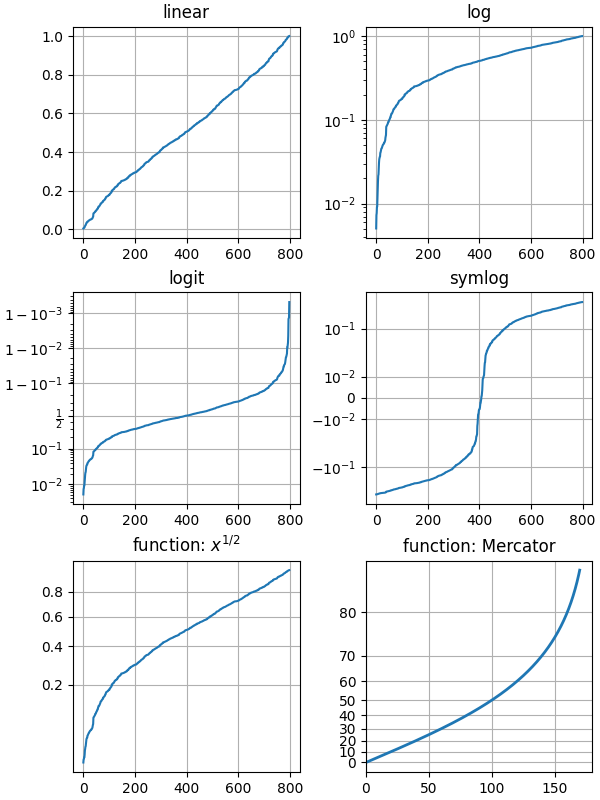
import numpy as npimport matplotlib.pyplot as pltfrom matplotlib.ticker import NullFormatter# Fixing random state for reproducibilitynp.random.seed(19680801)# make up some data in the interval ]0, 1[y = np.random.normal(loc=0.5, scale=0.4, size=1000)y = y[(y > 0) & (y < 1)]y.sort()x = np.arange(len(y))# plot with various axes scalesfig, axs = plt.subplots(2, 2, sharex=True)fig.subplots_adjust(left=0.08, right=0.98, wspace=0.3)# linearax = axs[0, 0]ax.plot(x, y)ax.set_yscale('linear')ax.set_title('linear')ax.grid(True)# logax = axs[0, 1]ax.plot(x, y)ax.set_yscale('log')ax.set_title('log')ax.grid(True)# symmetric logax = axs[1, 1]ax.plot(x, y - y.mean())ax.set_yscale('symlog', linthreshy=0.02)ax.set_title('symlog')ax.grid(True)# logitax = axs[1, 0]ax.plot(x, y)ax.set_yscale('logit')ax.set_title('logit')ax.grid(True)ax.yaxis.set_minor_formatter(NullFormatter())plt.show()
下载这个示例

若有收获,就点个赞吧
0 人点赞
