3D绘图作为子图
展示包括3D图作为子图。
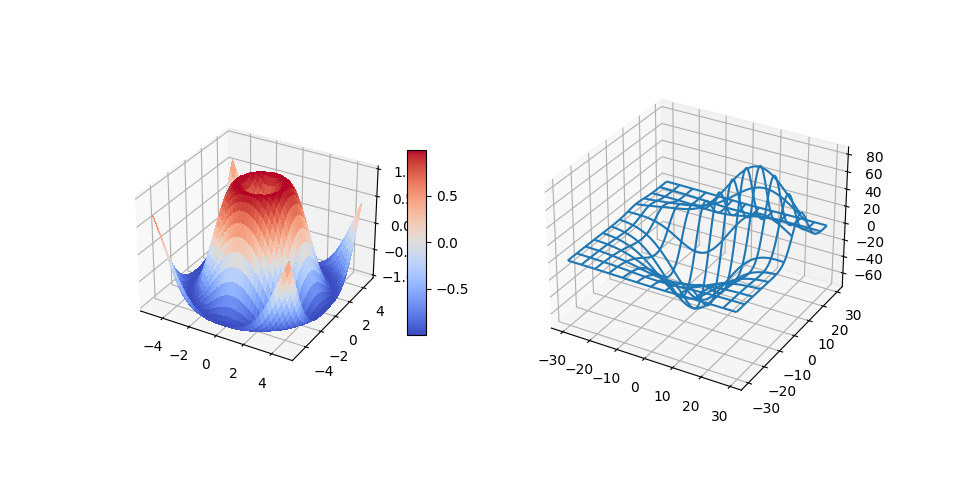
import matplotlib.pyplot as pltfrom matplotlib import cmimport numpy as npfrom mpl_toolkits.mplot3d.axes3d import get_test_data# This import registers the 3D projection, but is otherwise unused.from mpl_toolkits.mplot3d import Axes3D # noqa: F401 unused import# set up a figure twice as wide as it is tallfig = plt.figure(figsize=plt.figaspect(0.5))#===============# First subplot#===============# set up the axes for the first plotax = fig.add_subplot(1, 2, 1, projection='3d')# plot a 3D surface like in the example mplot3d/surface3d_demoX = np.arange(-5, 5, 0.25)Y = np.arange(-5, 5, 0.25)X, Y = np.meshgrid(X, Y)R = np.sqrt(X**2 + Y**2)Z = np.sin(R)surf = ax.plot_surface(X, Y, Z, rstride=1, cstride=1, cmap=cm.coolwarm,linewidth=0, antialiased=False)ax.set_zlim(-1.01, 1.01)fig.colorbar(surf, shrink=0.5, aspect=10)#===============# Second subplot#===============# set up the axes for the second plotax = fig.add_subplot(1, 2, 2, projection='3d')# plot a 3D wireframe like in the example mplot3d/wire3d_demoX, Y, Z = get_test_data(0.05)ax.plot_wireframe(X, Y, Z, rstride=10, cstride=10)plt.show()
下载这个示例

若有收获,就点个赞吧
0 人点赞
