演示高级箭图和箭袋功能
为箭袋)展示一些更高级的选项。有关简单示例,请参阅 Quiver Simple Demo。
已知问题:自动缩放图未考虑箭头,因此边界上的那些通常不在图中。以完全一般的方式解决这个问题并不容易。解决方法是手动展开Axes对象。
import matplotlib.pyplot as pltimport numpy as npX, Y = np.meshgrid(np.arange(0, 2 * np.pi, .2), np.arange(0, 2 * np.pi, .2))U = np.cos(X)V = np.sin(Y)fig1, ax1 = plt.subplots()ax1.set_title('Arrows scale with plot width, not view')Q = ax1.quiver(X, Y, U, V, units='width')qk = ax1.quiverkey(Q, 0.9, 0.9, 2, r'$2 \frac{m}{s}$', labelpos='E',coordinates='figure')
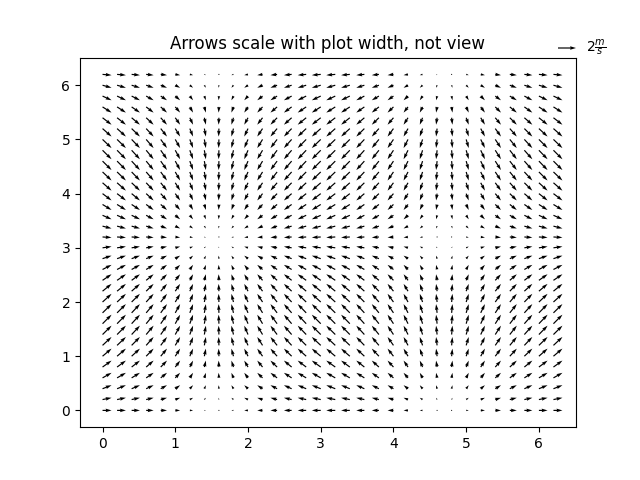
fig2, ax2 = plt.subplots()ax2.set_title("pivot='mid'; every third arrow; units='inches'")Q = ax2.quiver(X[::3, ::3], Y[::3, ::3], U[::3, ::3], V[::3, ::3],pivot='mid', units='inches')qk = ax2.quiverkey(Q, 0.9, 0.9, 1, r'$1 \frac{m}{s}$', labelpos='E',coordinates='figure')ax2.scatter(X[::3, ::3], Y[::3, ::3], color='r', s=5)
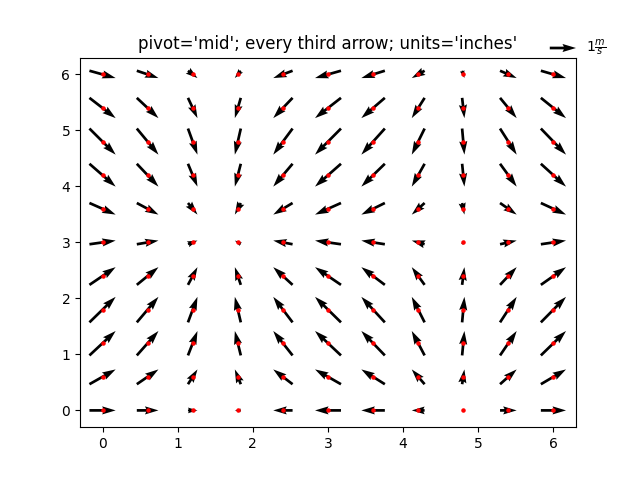
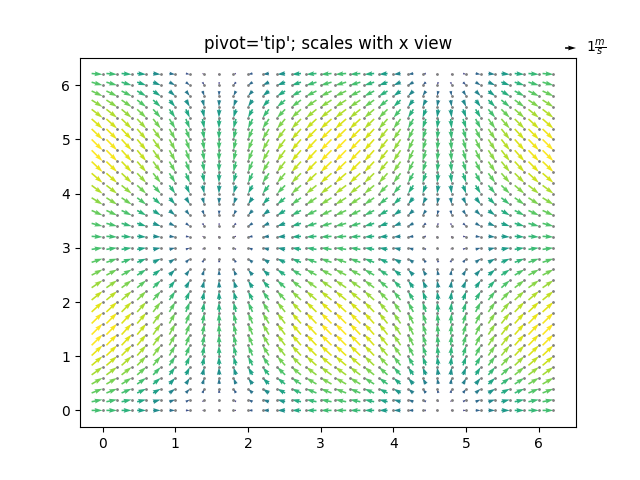
fig3, ax3 = plt.subplots()ax3.set_title("pivot='tip'; scales with x view")M = np.hypot(U, V)Q = ax3.quiver(X, Y, U, V, M, units='x', pivot='tip', width=0.022,scale=1 / 0.15)qk = ax3.quiverkey(Q, 0.9, 0.9, 1, r'$1 \frac{m}{s}$', labelpos='E',coordinates='figure')ax3.scatter(X, Y, color='k', s=5)plt.show()
参考
此示例中显示了以下函数和方法的用法:
import matplotlibmatplotlib.axes.Axes.quivermatplotlib.pyplot.quivermatplotlib.axes.Axes.quiverkeymatplotlib.pyplot.quiverkey
下载这个示例

若有收获,就点个赞吧
0 人点赞
