axhspan 演示
创建在水平方向或垂直方向跨越轴的直线或矩形。
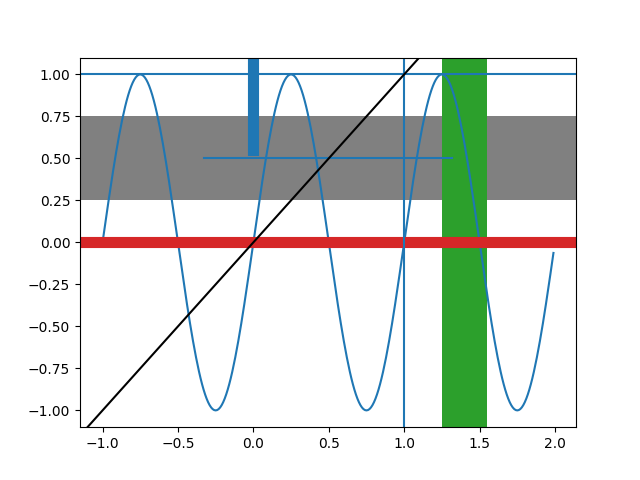
import numpy as npimport matplotlib.pyplot as pltt = np.arange(-1, 2, .01)s = np.sin(2 * np.pi * t)plt.plot(t, s)# Draw a thick red hline at y=0 that spans the xrangeplt.axhline(linewidth=8, color='#d62728')# Draw a default hline at y=1 that spans the xrangeplt.axhline(y=1)# Draw a default vline at x=1 that spans the yrangeplt.axvline(x=1)# Draw a thick blue vline at x=0 that spans the upper quadrant of the yrangeplt.axvline(x=0, ymin=0.75, linewidth=8, color='#1f77b4')# Draw a default hline at y=.5 that spans the middle half of the axesplt.axhline(y=.5, xmin=0.25, xmax=0.75)plt.axhspan(0.25, 0.75, facecolor='0.5', alpha=0.5)plt.axvspan(1.25, 1.55, facecolor='#2ca02c', alpha=0.5)plt.axis([-1, 2, -1, 2])plt.show()
下载这个示例

若有收获,就点个赞吧
0 人点赞
