探索规范化
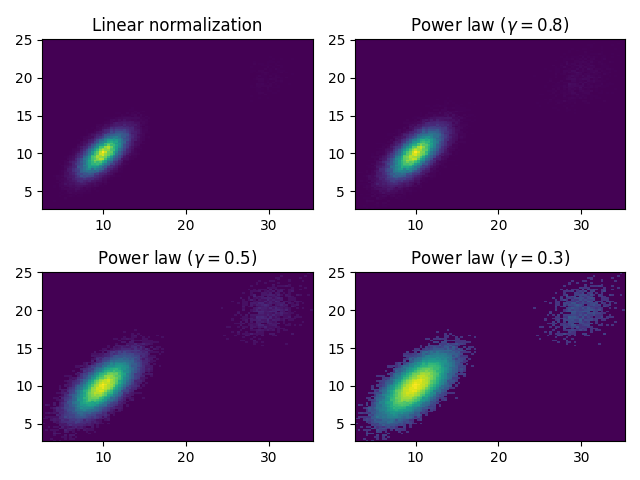
多元正态分布的各种归一化。
import matplotlib.pyplot as pltimport matplotlib.colors as mcolorsimport numpy as npfrom numpy.random import multivariate_normaldata = np.vstack([multivariate_normal([10, 10], [[3, 2], [2, 3]], size=100000),multivariate_normal([30, 20], [[2, 3], [1, 3]], size=1000)])gammas = [0.8, 0.5, 0.3]fig, axes = plt.subplots(nrows=2, ncols=2)axes[0, 0].set_title('Linear normalization')axes[0, 0].hist2d(data[:, 0], data[:, 1], bins=100)for ax, gamma in zip(axes.flat[1:], gammas):ax.set_title(r'Power law $(\gamma=%1.1f)$' % gamma)ax.hist2d(data[:, 0], data[:, 1],bins=100, norm=mcolors.PowerNorm(gamma))fig.tight_layout()plt.show()
参考
此示例中显示了以下函数,方法,类和模块的使用:
import matplotlibmatplotlib.colorsmatplotlib.colors.PowerNormmatplotlib.axes.Axes.hist2dmatplotlib.pyplot.hist2d
下载这个示例

若有收获,就点个赞吧
0 人点赞
