带有rgb颜色的3D体素/体积图
演示使用ax.voxels可视化颜色空间的各个部分
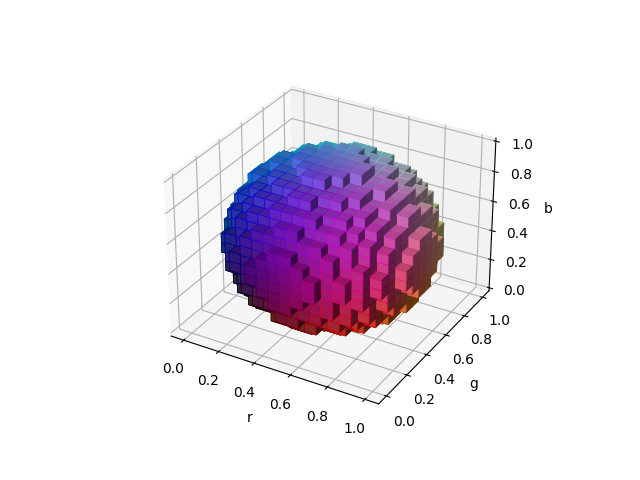
import matplotlib.pyplot as pltimport numpy as np# This import registers the 3D projection, but is otherwise unused.from mpl_toolkits.mplot3d import Axes3D # noqa: F401 unused importdef midpoints(x):sl = ()for i in range(x.ndim):x = (x[sl + np.index_exp[:-1]] + x[sl + np.index_exp[1:]]) / 2.0sl += np.index_exp[:]return x# prepare some coordinates, and attach rgb values to eachr, g, b = np.indices((17, 17, 17)) / 16.0rc = midpoints(r)gc = midpoints(g)bc = midpoints(b)# define a sphere about [0.5, 0.5, 0.5]sphere = (rc - 0.5)**2 + (gc - 0.5)**2 + (bc - 0.5)**2 < 0.5**2# combine the color componentscolors = np.zeros(sphere.shape + (3,))colors[..., 0] = rccolors[..., 1] = gccolors[..., 2] = bc# and plot everythingfig = plt.figure()ax = fig.gca(projection='3d')ax.voxels(r, g, b, sphere,facecolors=colors,edgecolors=np.clip(2*colors - 0.5, 0, 1), # brighterlinewidth=0.5)ax.set(xlabel='r', ylabel='g', zlabel='b')plt.show()
下载这个示例

若有收获,就点个赞吧
0 人点赞
