Tripcolor Demo
非结构化三角形网格的伪彩色图。
import matplotlib.pyplot as pltimport matplotlib.tri as triimport numpy as np
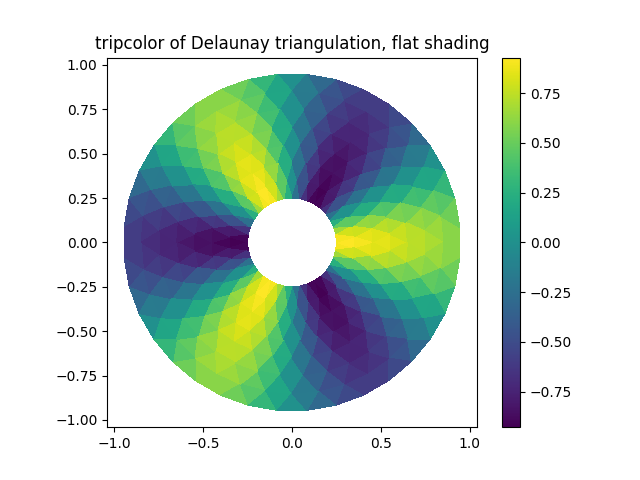
在不指定三角形的情况下创建三角剖分会导致点的Delaunay三角剖分。
# First create the x and y coordinates of the points.n_angles = 36n_radii = 8min_radius = 0.25radii = np.linspace(min_radius, 0.95, n_radii)angles = np.linspace(0, 2 * np.pi, n_angles, endpoint=False)angles = np.repeat(angles[..., np.newaxis], n_radii, axis=1)angles[:, 1::2] += np.pi / n_anglesx = (radii * np.cos(angles)).flatten()y = (radii * np.sin(angles)).flatten()z = (np.cos(radii) * np.cos(3 * angles)).flatten()# Create the Triangulation; no triangles so Delaunay triangulation created.triang = tri.Triangulation(x, y)# Mask off unwanted triangles.triang.set_mask(np.hypot(x[triang.triangles].mean(axis=1),y[triang.triangles].mean(axis=1))< min_radius)
tripcolor plot.
fig1, ax1 = plt.subplots()ax1.set_aspect('equal')tpc = ax1.tripcolor(triang, z, shading='flat')fig1.colorbar(tpc)ax1.set_title('tripcolor of Delaunay triangulation, flat shading')
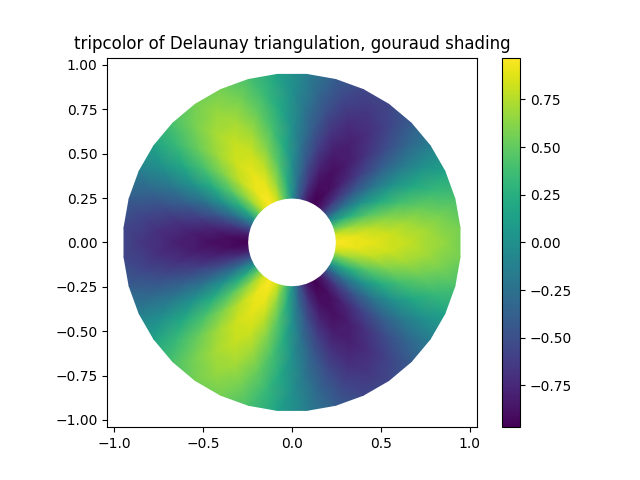
说明Gouraud阴影。
fig2, ax2 = plt.subplots()ax2.set_aspect('equal')tpc = ax2.tripcolor(triang, z, shading='gouraud')fig2.colorbar(tpc)ax2.set_title('tripcolor of Delaunay triangulation, gouraud shading')
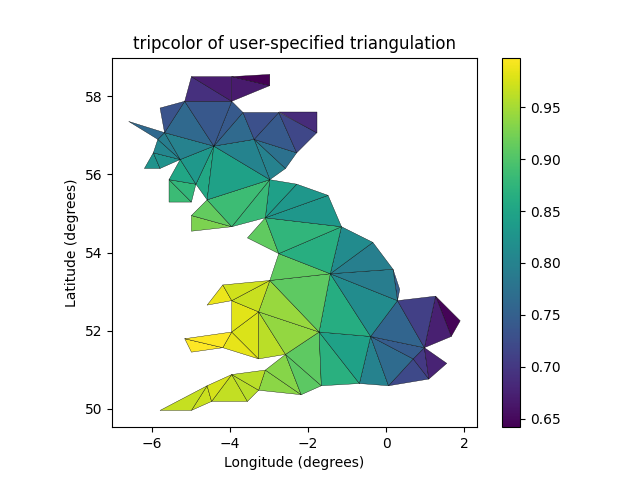
您可以指定自己的三角剖分而不是执行点的Delaunay三角剖分,其中每个三角形由构成三角形的三个点的索引给出,以顺时针或逆时针方式排序。
xy = np.asarray([[-0.101, 0.872], [-0.080, 0.883], [-0.069, 0.888], [-0.054, 0.890],[-0.045, 0.897], [-0.057, 0.895], [-0.073, 0.900], [-0.087, 0.898],[-0.090, 0.904], [-0.069, 0.907], [-0.069, 0.921], [-0.080, 0.919],[-0.073, 0.928], [-0.052, 0.930], [-0.048, 0.942], [-0.062, 0.949],[-0.054, 0.958], [-0.069, 0.954], [-0.087, 0.952], [-0.087, 0.959],[-0.080, 0.966], [-0.085, 0.973], [-0.087, 0.965], [-0.097, 0.965],[-0.097, 0.975], [-0.092, 0.984], [-0.101, 0.980], [-0.108, 0.980],[-0.104, 0.987], [-0.102, 0.993], [-0.115, 1.001], [-0.099, 0.996],[-0.101, 1.007], [-0.090, 1.010], [-0.087, 1.021], [-0.069, 1.021],[-0.052, 1.022], [-0.052, 1.017], [-0.069, 1.010], [-0.064, 1.005],[-0.048, 1.005], [-0.031, 1.005], [-0.031, 0.996], [-0.040, 0.987],[-0.045, 0.980], [-0.052, 0.975], [-0.040, 0.973], [-0.026, 0.968],[-0.020, 0.954], [-0.006, 0.947], [ 0.003, 0.935], [ 0.006, 0.926],[ 0.005, 0.921], [ 0.022, 0.923], [ 0.033, 0.912], [ 0.029, 0.905],[ 0.017, 0.900], [ 0.012, 0.895], [ 0.027, 0.893], [ 0.019, 0.886],[ 0.001, 0.883], [-0.012, 0.884], [-0.029, 0.883], [-0.038, 0.879],[-0.057, 0.881], [-0.062, 0.876], [-0.078, 0.876], [-0.087, 0.872],[-0.030, 0.907], [-0.007, 0.905], [-0.057, 0.916], [-0.025, 0.933],[-0.077, 0.990], [-0.059, 0.993]])x, y = np.rad2deg(xy).Ttriangles = np.asarray([[67, 66, 1], [65, 2, 66], [ 1, 66, 2], [64, 2, 65], [63, 3, 64],[60, 59, 57], [ 2, 64, 3], [ 3, 63, 4], [ 0, 67, 1], [62, 4, 63],[57, 59, 56], [59, 58, 56], [61, 60, 69], [57, 69, 60], [ 4, 62, 68],[ 6, 5, 9], [61, 68, 62], [69, 68, 61], [ 9, 5, 70], [ 6, 8, 7],[ 4, 70, 5], [ 8, 6, 9], [56, 69, 57], [69, 56, 52], [70, 10, 9],[54, 53, 55], [56, 55, 53], [68, 70, 4], [52, 56, 53], [11, 10, 12],[69, 71, 68], [68, 13, 70], [10, 70, 13], [51, 50, 52], [13, 68, 71],[52, 71, 69], [12, 10, 13], [71, 52, 50], [71, 14, 13], [50, 49, 71],[49, 48, 71], [14, 16, 15], [14, 71, 48], [17, 19, 18], [17, 20, 19],[48, 16, 14], [48, 47, 16], [47, 46, 16], [16, 46, 45], [23, 22, 24],[21, 24, 22], [17, 16, 45], [20, 17, 45], [21, 25, 24], [27, 26, 28],[20, 72, 21], [25, 21, 72], [45, 72, 20], [25, 28, 26], [44, 73, 45],[72, 45, 73], [28, 25, 29], [29, 25, 31], [43, 73, 44], [73, 43, 40],[72, 73, 39], [72, 31, 25], [42, 40, 43], [31, 30, 29], [39, 73, 40],[42, 41, 40], [72, 33, 31], [32, 31, 33], [39, 38, 72], [33, 72, 38],[33, 38, 34], [37, 35, 38], [34, 38, 35], [35, 37, 36]])xmid = x[triangles].mean(axis=1)ymid = y[triangles].mean(axis=1)x0 = -5y0 = 52zfaces = np.exp(-0.01 * ((xmid - x0) * (xmid - x0) +(ymid - y0) * (ymid - y0)))
而不是创建Triangulation对象,可以直接将x,y和三角形数组传递给tripcolor。 如果要多次使用相同的三角测量来保存重复计算,最好使用Triangulation对象。 通过使用facecolors kwarg,可以为每个面指定一个颜色值,而不是每个点指定一个颜色值。
fig3, ax3 = plt.subplots()ax3.set_aspect('equal')tpc = ax3.tripcolor(x, y, triangles, facecolors=zfaces, edgecolors='k')fig3.colorbar(tpc)ax3.set_title('tripcolor of user-specified triangulation')ax3.set_xlabel('Longitude (degrees)')ax3.set_ylabel('Latitude (degrees)')plt.show()
参考
此示例中显示了以下函数,方法,类和模块的使用:
import matplotlibmatplotlib.axes.Axes.tripcolormatplotlib.pyplot.tripcolormatplotlib.trimatplotlib.tri.Triangulation
下载这个示例

若有收获,就点个赞吧
0 人点赞
