Spines图
这个演示比较:
- 正常轴,四边都有spine;
- 仅在左侧和底部有spine的轴;
- 使用自定义边界限制spine范围的轴。
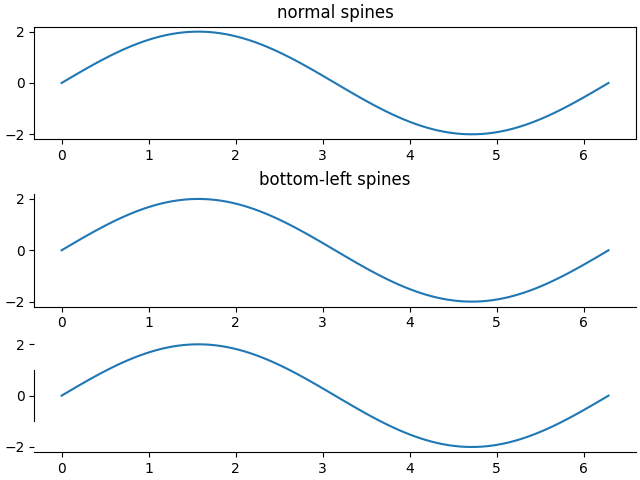
import numpy as npimport matplotlib.pyplot as pltx = np.linspace(0, 2 * np.pi, 100)y = 2 * np.sin(x)fig, (ax0, ax1, ax2) = plt.subplots(nrows=3)ax0.plot(x, y)ax0.set_title('normal spines')ax1.plot(x, y)ax1.set_title('bottom-left spines')# Hide the right and top spinesax1.spines['right'].set_visible(False)ax1.spines['top'].set_visible(False)# Only show ticks on the left and bottom spinesax1.yaxis.set_ticks_position('left')ax1.xaxis.set_ticks_position('bottom')ax2.plot(x, y)# Only draw spine between the y-ticksax2.spines['left'].set_bounds(-1, 1)# Hide the right and top spinesax2.spines['right'].set_visible(False)ax2.spines['top'].set_visible(False)# Only show ticks on the left and bottom spinesax2.yaxis.set_ticks_position('left')ax2.xaxis.set_ticks_position('bottom')# Tweak spacing between subplots to prevent labels from overlappingplt.subplots_adjust(hspace=0.5)plt.show()
下载这个示例

若有收获,就点个赞吧
0 人点赞
