Zorder演示
轴的默认绘制顺序是补丁,线条,文本。 此顺序由zorder属性确定。 设置以下默认值
| Artist | Z-order |
|---|---|
| Patch / PatchCollection | 1 |
| Line2D / LineCollection | 2 |
| Text | 3 |
您可以通过设置zorder来更改单个艺术家的顺序。任何单独的plot() 调用都可以为该特定项的zorder设置一个值。
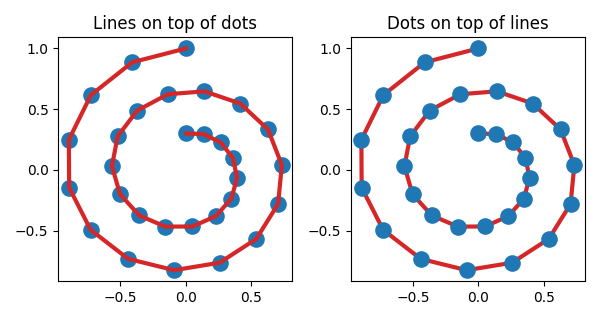
在下面的第一个子图中,线条在散点图上方的补丁集合上方绘制,这是默认值。
在下面的子图中,顺序颠倒过来。
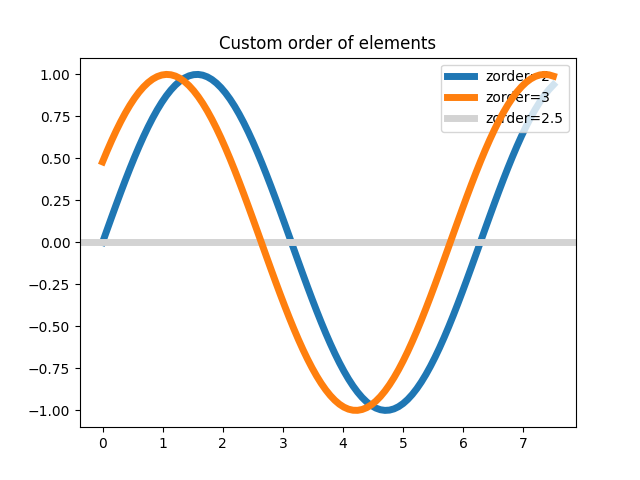
第二个图显示了如何控制各行的zorder。
import matplotlib.pyplot as pltimport numpy as np# Fixing random state for reproducibilitynp.random.seed(19680801)x = np.random.random(20)y = np.random.random(20)
分散的顶部的线
plt.figure()plt.subplot(211)plt.plot(x, y, 'C3', lw=3)plt.scatter(x, y, s=120)plt.title('Lines on top of dots')# Scatter plot on top of linesplt.subplot(212)plt.plot(x, y, 'C3', zorder=1, lw=3)plt.scatter(x, y, s=120, zorder=2)plt.title('Dots on top of lines')plt.tight_layout()
一个新的图像,带有单独订购的物品
x = np.linspace(0, 2*np.pi, 100)plt.rcParams['lines.linewidth'] = 10plt.figure()plt.plot(x, np.sin(x), label='zorder=10', zorder=10) # on topplt.plot(x, np.sin(1.1*x), label='zorder=1', zorder=1) # bottomplt.plot(x, np.sin(1.2*x), label='zorder=3', zorder=3)plt.axhline(0, label='zorder=2', color='grey', zorder=2)plt.title('Custom order of elements')l = plt.legend(loc='upper right')l.set_zorder(20) # put the legend on topplt.show()
下载这个示例

若有收获,就点个赞吧
0 人点赞
