演示Axes Grid2
共享xaxis和yaxis的图像网格。
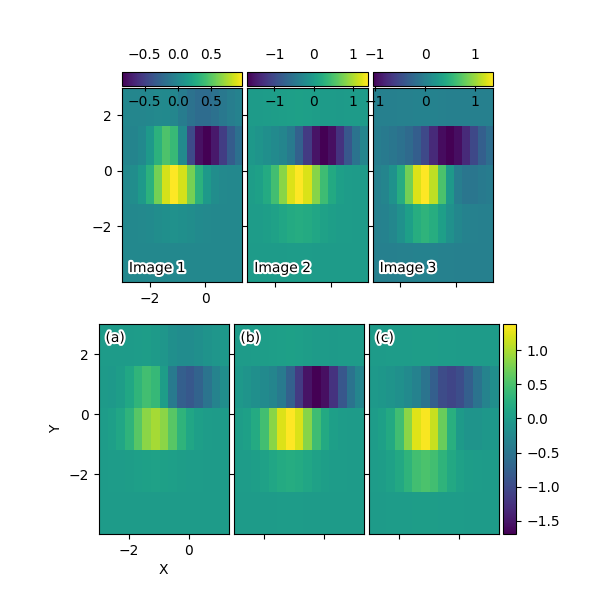
import matplotlib.pyplot as pltfrom mpl_toolkits.axes_grid1 import ImageGridimport numpy as npdef get_demo_image():from matplotlib.cbook import get_sample_dataf = get_sample_data("axes_grid/bivariate_normal.npy", asfileobj=False)z = np.load(f)# z is a numpy array of 15x15return z, (-3, 4, -4, 3)def add_inner_title(ax, title, loc, size=None, **kwargs):from matplotlib.offsetbox import AnchoredTextfrom matplotlib.patheffects import withStrokeif size is None:size = dict(size=plt.rcParams['legend.fontsize'])at = AnchoredText(title, loc=loc, prop=size,pad=0., borderpad=0.5,frameon=False, **kwargs)ax.add_artist(at)at.txt._text.set_path_effects([withStroke(foreground="w", linewidth=3)])return atif 1:F = plt.figure(1, (6, 6))F.clf()# prepare imagesZ, extent = get_demo_image()ZS = [Z[i::3, :] for i in range(3)]extent = extent[0], extent[1]/3., extent[2], extent[3]# demo 1 : colorbar at each axesgrid = ImageGrid(F, 211, # similar to subplot(111)nrows_ncols=(1, 3),direction="row",axes_pad=0.05,add_all=True,label_mode="1",share_all=True,cbar_location="top",cbar_mode="each",cbar_size="7%",cbar_pad="1%",)for ax, z in zip(grid, ZS):im = ax.imshow(z, origin="lower", extent=extent, interpolation="nearest")ax.cax.colorbar(im)for ax, im_title in zip(grid, ["Image 1", "Image 2", "Image 3"]):t = add_inner_title(ax, im_title, loc='lower left')t.patch.set_alpha(0.5)for ax, z in zip(grid, ZS):ax.cax.toggle_label(True)#axis = ax.cax.axis[ax.cax.orientation]#axis.label.set_text("counts s$^{-1}$")#axis.label.set_size(10)#axis.major_ticklabels.set_size(6)# changing the colorbar ticksgrid[1].cax.set_xticks([-1, 0, 1])grid[2].cax.set_xticks([-1, 0, 1])grid[0].set_xticks([-2, 0])grid[0].set_yticks([-2, 0, 2])# demo 2 : shared colorbargrid2 = ImageGrid(F, 212,nrows_ncols=(1, 3),direction="row",axes_pad=0.05,add_all=True,label_mode="1",share_all=True,cbar_location="right",cbar_mode="single",cbar_size="10%",cbar_pad=0.05,)grid2[0].set_xlabel("X")grid2[0].set_ylabel("Y")vmax, vmin = np.max(ZS), np.min(ZS)import matplotlib.colorsnorm = matplotlib.colors.Normalize(vmax=vmax, vmin=vmin)for ax, z in zip(grid2, ZS):im = ax.imshow(z, norm=norm,origin="lower", extent=extent,interpolation="nearest")# With cbar_mode="single", cax attribute of all axes are identical.ax.cax.colorbar(im)ax.cax.toggle_label(True)for ax, im_title in zip(grid2, ["(a)", "(b)", "(c)"]):t = add_inner_title(ax, im_title, loc='upper left')t.patch.set_ec("none")t.patch.set_alpha(0.5)grid2[0].set_xticks([-2, 0])grid2[0].set_yticks([-2, 0, 2])plt.show()
下载这个示例

若有收获,就点个赞吧
0 人点赞
