自定义投影
通过减轻Matplotlib的许多功能来展示Hammer投影。
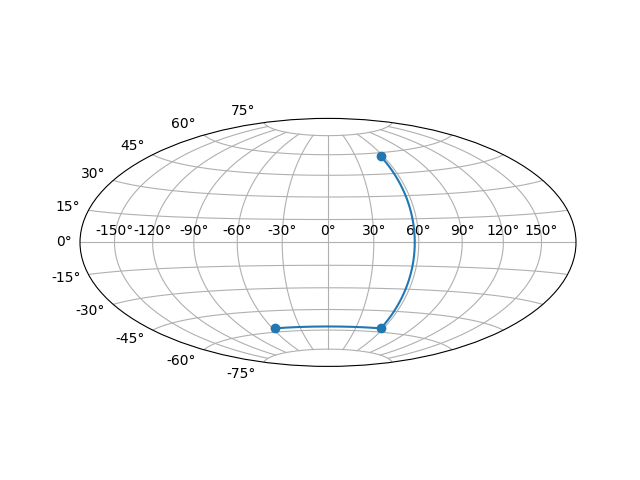
import matplotlibfrom matplotlib.axes import Axesfrom matplotlib.patches import Circlefrom matplotlib.path import Pathfrom matplotlib.ticker import NullLocator, Formatter, FixedLocatorfrom matplotlib.transforms import Affine2D, BboxTransformTo, Transformfrom matplotlib.projections import register_projectionimport matplotlib.spines as mspinesimport matplotlib.axis as maxisimport numpy as nprcParams = matplotlib.rcParams# This example projection class is rather long, but it is designed to# illustrate many features, not all of which will be used every time.# It is also common to factor out a lot of these methods into common# code used by a number of projections with similar characteristics# (see geo.py).class GeoAxes(Axes):"""An abstract base class for geographic projections"""class ThetaFormatter(Formatter):"""Used to format the theta tick labels. Converts the nativeunit of radians into degrees and adds a degree symbol."""def __init__(self, round_to=1.0):self._round_to = round_todef __call__(self, x, pos=None):degrees = np.round(np.rad2deg(x) / self._round_to) * self._round_toif rcParams['text.usetex'] and not rcParams['text.latex.unicode']:return r"$%0.0f^\circ$" % degreeselse:return "%0.0f\N{DEGREE SIGN}" % degreesRESOLUTION = 75def _init_axis(self):self.xaxis = maxis.XAxis(self)self.yaxis = maxis.YAxis(self)# Do not register xaxis or yaxis with spines -- as done in# Axes._init_axis() -- until GeoAxes.xaxis.cla() works.# self.spines['geo'].register_axis(self.yaxis)self._update_transScale()def cla(self):Axes.cla(self)self.set_longitude_grid(30)self.set_latitude_grid(15)self.set_longitude_grid_ends(75)self.xaxis.set_minor_locator(NullLocator())self.yaxis.set_minor_locator(NullLocator())self.xaxis.set_ticks_position('none')self.yaxis.set_ticks_position('none')self.yaxis.set_tick_params(label1On=True)# Why do we need to turn on yaxis tick labels, but# xaxis tick labels are already on?self.grid(rcParams['axes.grid'])Axes.set_xlim(self, -np.pi, np.pi)Axes.set_ylim(self, -np.pi / 2.0, np.pi / 2.0)def _set_lim_and_transforms(self):# A (possibly non-linear) projection on the (already scaled) data# There are three important coordinate spaces going on here:## 1. Data space: The space of the data itself## 2. Axes space: The unit rectangle (0, 0) to (1, 1)# covering the entire plot area.## 3. Display space: The coordinates of the resulting image,# often in pixels or dpi/inch.# This function makes heavy use of the Transform classes in# ``lib/matplotlib/transforms.py.`` For more information, see# the inline documentation there.# The goal of the first two transformations is to get from the# data space (in this case longitude and latitude) to axes# space. It is separated into a non-affine and affine part so# that the non-affine part does not have to be recomputed when# a simple affine change to the figure has been made (such as# resizing the window or changing the dpi).# 1) The core transformation from data space into# rectilinear space defined in the HammerTransform class.self.transProjection = self._get_core_transform(self.RESOLUTION)# 2) The above has an output range that is not in the unit# rectangle, so scale and translate it so it fits correctly# within the axes. The peculiar calculations of xscale and# yscale are specific to a Aitoff-Hammer projection, so don't# worry about them too much.self.transAffine = self._get_affine_transform()# 3) This is the transformation from axes space to display# space.self.transAxes = BboxTransformTo(self.bbox)# Now put these 3 transforms together -- from data all the way# to display coordinates. Using the '+' operator, these# transforms will be applied "in order". The transforms are# automatically simplified, if possible, by the underlying# transformation framework.self.transData = \self.transProjection + \self.transAffine + \self.transAxes# The main data transformation is set up. Now deal with# gridlines and tick labels.# Longitude gridlines and ticklabels. The input to these# transforms are in display space in x and axes space in y.# Therefore, the input values will be in range (-xmin, 0),# (xmax, 1). The goal of these transforms is to go from that# space to display space. The tick labels will be offset 4# pixels from the equator.self._xaxis_pretransform = \Affine2D() \.scale(1.0, self._longitude_cap * 2.0) \.translate(0.0, -self._longitude_cap)self._xaxis_transform = \self._xaxis_pretransform + \self.transDataself._xaxis_text1_transform = \Affine2D().scale(1.0, 0.0) + \self.transData + \Affine2D().translate(0.0, 4.0)self._xaxis_text2_transform = \Affine2D().scale(1.0, 0.0) + \self.transData + \Affine2D().translate(0.0, -4.0)# Now set up the transforms for the latitude ticks. The input to# these transforms are in axes space in x and display space in# y. Therefore, the input values will be in range (0, -ymin),# (1, ymax). The goal of these transforms is to go from that# space to display space. The tick labels will be offset 4# pixels from the edge of the axes ellipse.yaxis_stretch = Affine2D().scale(np.pi*2, 1).translate(-np.pi, 0)yaxis_space = Affine2D().scale(1.0, 1.1)self._yaxis_transform = \yaxis_stretch + \self.transDatayaxis_text_base = \yaxis_stretch + \self.transProjection + \(yaxis_space +self.transAffine +self.transAxes)self._yaxis_text1_transform = \yaxis_text_base + \Affine2D().translate(-8.0, 0.0)self._yaxis_text2_transform = \yaxis_text_base + \Affine2D().translate(8.0, 0.0)def _get_affine_transform(self):transform = self._get_core_transform(1)xscale, _ = transform.transform_point((np.pi, 0))_, yscale = transform.transform_point((0, np.pi / 2.0))return Affine2D() \.scale(0.5 / xscale, 0.5 / yscale) \.translate(0.5, 0.5)def get_xaxis_transform(self, which='grid'):"""Override this method to provide a transformation for thex-axis tick labels.Returns a tuple of the form (transform, valign, halign)"""if which not in ['tick1', 'tick2', 'grid']:raise ValueError("'which' must be one of 'tick1', 'tick2', or 'grid'")return self._xaxis_transformdef get_xaxis_text1_transform(self, pad):return self._xaxis_text1_transform, 'bottom', 'center'def get_xaxis_text2_transform(self, pad):"""Override this method to provide a transformation for thesecondary x-axis tick labels.Returns a tuple of the form (transform, valign, halign)"""return self._xaxis_text2_transform, 'top', 'center'def get_yaxis_transform(self, which='grid'):"""Override this method to provide a transformation for they-axis grid and ticks."""if which not in ['tick1', 'tick2', 'grid']:raise ValueError("'which' must be one of 'tick1', 'tick2', or 'grid'")return self._yaxis_transformdef get_yaxis_text1_transform(self, pad):"""Override this method to provide a transformation for they-axis tick labels.Returns a tuple of the form (transform, valign, halign)"""return self._yaxis_text1_transform, 'center', 'right'def get_yaxis_text2_transform(self, pad):"""Override this method to provide a transformation for thesecondary y-axis tick labels.Returns a tuple of the form (transform, valign, halign)"""return self._yaxis_text2_transform, 'center', 'left'def _gen_axes_patch(self):"""Override this method to define the shape that is used for thebackground of the plot. It should be a subclass of Patch.In this case, it is a Circle (that may be warped by the axestransform into an ellipse). Any data and gridlines will beclipped to this shape."""return Circle((0.5, 0.5), 0.5)def _gen_axes_spines(self):return {'geo': mspines.Spine.circular_spine(self, (0.5, 0.5), 0.5)}def set_yscale(self, *args, **kwargs):if args[0] != 'linear':raise NotImplementedError# Prevent the user from applying scales to one or both of the# axes. In this particular case, scaling the axes wouldn't make# sense, so we don't allow it.set_xscale = set_yscale# Prevent the user from changing the axes limits. In our case, we# want to display the whole sphere all the time, so we override# set_xlim and set_ylim to ignore any input. This also applies to# interactive panning and zooming in the GUI interfaces.def set_xlim(self, *args, **kwargs):raise TypeError("It is not possible to change axes limits ""for geographic projections. Please consider ""using Basemap or Cartopy.")set_ylim = set_xlimdef format_coord(self, lon, lat):"""Override this method to change how the values are displayed inthe status bar.In this case, we want them to be displayed in degrees N/S/E/W."""lon, lat = np.rad2deg([lon, lat])if lat >= 0.0:ns = 'N'else:ns = 'S'if lon >= 0.0:ew = 'E'else:ew = 'W'return ('%f\N{DEGREE SIGN}%s, %f\N{DEGREE SIGN}%s'% (abs(lat), ns, abs(lon), ew))def set_longitude_grid(self, degrees):"""Set the number of degrees between each longitude grid.This is an example method that is specific to this projectionclass -- it provides a more convenient interface to set theticking than set_xticks would."""# Skip -180 and 180, which are the fixed limits.grid = np.arange(-180 + degrees, 180, degrees)self.xaxis.set_major_locator(FixedLocator(np.deg2rad(grid)))self.xaxis.set_major_formatter(self.ThetaFormatter(degrees))def set_latitude_grid(self, degrees):"""Set the number of degrees between each longitude grid.This is an example method that is specific to this projectionclass -- it provides a more convenient interface thanset_yticks would."""# Skip -90 and 90, which are the fixed limits.grid = np.arange(-90 + degrees, 90, degrees)self.yaxis.set_major_locator(FixedLocator(np.deg2rad(grid)))self.yaxis.set_major_formatter(self.ThetaFormatter(degrees))def set_longitude_grid_ends(self, degrees):"""Set the latitude(s) at which to stop drawing the longitude grids.Often, in geographic projections, you wouldn't want to drawlongitude gridlines near the poles. This allows the user tospecify the degree at which to stop drawing longitude grids.This is an example method that is specific to this projectionclass -- it provides an interface to something that has noanalogy in the base Axes class."""self._longitude_cap = np.deg2rad(degrees)self._xaxis_pretransform \.clear() \.scale(1.0, self._longitude_cap * 2.0) \.translate(0.0, -self._longitude_cap)def get_data_ratio(self):"""Return the aspect ratio of the data itself.This method should be overridden by any Axes that have afixed data ratio."""return 1.0# Interactive panning and zooming is not supported with this projection,# so we override all of the following methods to disable it.def can_zoom(self):"""Return *True* if this axes supports the zoom box button functionality.This axes object does not support interactive zoom box."""return Falsedef can_pan(self):"""Return *True* if this axes supports the pan/zoom button functionality.This axes object does not support interactive pan/zoom."""return Falsedef start_pan(self, x, y, button):passdef end_pan(self):passdef drag_pan(self, button, key, x, y):passclass HammerAxes(GeoAxes):"""A custom class for the Aitoff-Hammer projection, an equal-area mapprojection.https://en.wikipedia.org/wiki/Hammer_projection"""# The projection must specify a name. This will be used by the# user to select the projection,# i.e. ``subplot(111, projection='custom_hammer')``.name = 'custom_hammer'class HammerTransform(Transform):"""The base Hammer transform."""input_dims = 2output_dims = 2is_separable = Falsedef __init__(self, resolution):"""Create a new Hammer transform. Resolution is the number of stepsto interpolate between each input line segment to approximate itspath in curved Hammer space."""Transform.__init__(self)self._resolution = resolutiondef transform_non_affine(self, ll):longitude, latitude = ll.T# Pre-compute some valueshalf_long = longitude / 2cos_latitude = np.cos(latitude)sqrt2 = np.sqrt(2)alpha = np.sqrt(1 + cos_latitude * np.cos(half_long))x = (2 * sqrt2) * (cos_latitude * np.sin(half_long)) / alphay = (sqrt2 * np.sin(latitude)) / alphareturn np.column_stack([x, y])transform_non_affine.__doc__ = Transform.transform_non_affine.__doc__def transform_path_non_affine(self, path):# vertices = path.verticesipath = path.interpolated(self._resolution)return Path(self.transform(ipath.vertices), ipath.codes)transform_path_non_affine.__doc__ = \Transform.transform_path_non_affine.__doc__def inverted(self):return HammerAxes.InvertedHammerTransform(self._resolution)inverted.__doc__ = Transform.inverted.__doc__class InvertedHammerTransform(Transform):input_dims = 2output_dims = 2is_separable = Falsedef __init__(self, resolution):Transform.__init__(self)self._resolution = resolutiondef transform_non_affine(self, xy):x, y = xy.Tz = np.sqrt(1 - (x / 4) ** 2 - (y / 2) ** 2)longitude = 2 * np.arctan((z * x) / (2 * (2 * z ** 2 - 1)))latitude = np.arcsin(y*z)return np.column_stack([longitude, latitude])transform_non_affine.__doc__ = Transform.transform_non_affine.__doc__def inverted(self):return HammerAxes.HammerTransform(self._resolution)inverted.__doc__ = Transform.inverted.__doc__def __init__(self, *args, **kwargs):self._longitude_cap = np.pi / 2.0GeoAxes.__init__(self, *args, **kwargs)self.set_aspect(0.5, adjustable='box', anchor='C')self.cla()def _get_core_transform(self, resolution):return self.HammerTransform(resolution)# Now register the projection with matplotlib so the user can select# it.register_projection(HammerAxes)if __name__ == '__main__':import matplotlib.pyplot as plt# Now make a simple example using the custom projection.plt.subplot(111, projection="custom_hammer")p = plt.plot([-1, 1, 1], [-1, -1, 1], "o-")plt.grid(True)plt.show()
下载这个示例

若有收获,就点个赞吧
0 人点赞
