Symlog演示
示例使用symlog(对称对数)轴缩放。
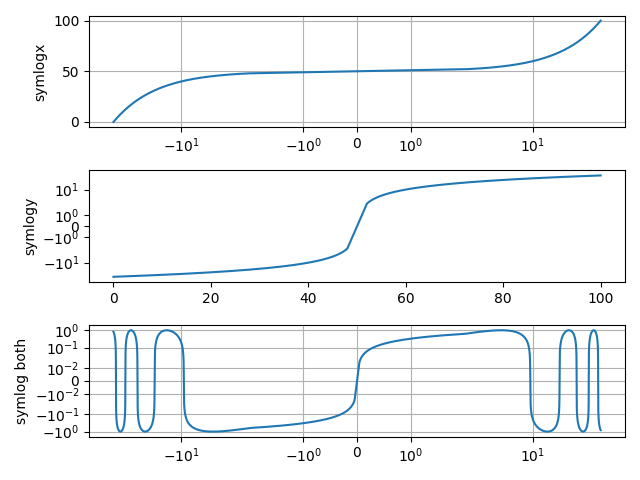
import matplotlib.pyplot as pltimport numpy as npdt = 0.01x = np.arange(-50.0, 50.0, dt)y = np.arange(0, 100.0, dt)plt.subplot(311)plt.plot(x, y)plt.xscale('symlog')plt.ylabel('symlogx')plt.grid(True)plt.gca().xaxis.grid(True, which='minor') # minor grid on tooplt.subplot(312)plt.plot(y, x)plt.yscale('symlog')plt.ylabel('symlogy')plt.subplot(313)plt.plot(x, np.sin(x / 3.0))plt.xscale('symlog')plt.yscale('symlog', linthreshy=0.015)plt.grid(True)plt.ylabel('symlog both')plt.tight_layout()plt.show()
下载这个示例

若有收获,就点个赞吧
0 人点赞
