Pyplot 绘制三条线
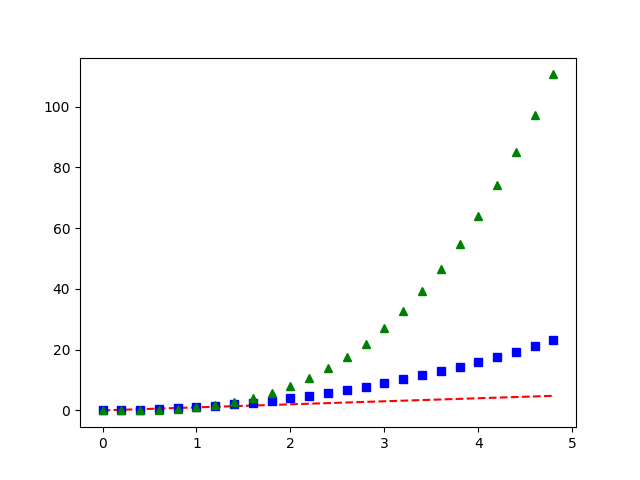
在一次调用 plot 绘图中绘制三个线图。
import numpy as npimport matplotlib.pyplot as plt# evenly sampled time at 200ms intervalst = np.arange(0., 5., 0.2)# red dashes, blue squares and green trianglesplt.plot(t, t, 'r--', t, t**2, 'bs', t, t**3, 'g^')plt.show()
参考
此示例显示了以下函数、方法、类和模块的使用:
import matplotlibmatplotlib.pyplot.plotmatplotlib.axes.Axes.plot
下载这个示例

若有收获,就点个赞吧
0 人点赞
