Contour手册
使用ContourSet显示自己的轮廓线和多边形的示例。
import matplotlib.pyplot as pltfrom matplotlib.contour import ContourSetimport matplotlib.cm as cm
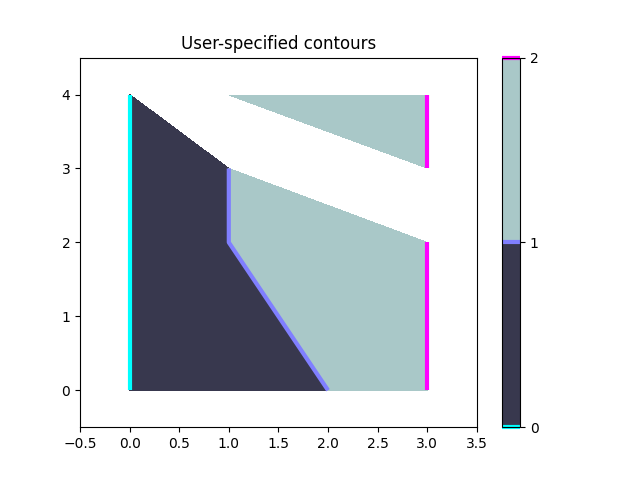
每个级别的轮廓线是多边形的列表/元组。
lines0 = [[[0, 0], [0, 4]]]lines1 = [[[2, 0], [1, 2], [1, 3]]]lines2 = [[[3, 0], [3, 2]], [[3, 3], [3, 4]]] # Note two lines.
两个级别之间的填充等高线也是多边形的列表/元组。点可以顺时针或逆时针排列。
filled01 = [[[0, 0], [0, 4], [1, 3], [1, 2], [2, 0]]]filled12 = [[[2, 0], [3, 0], [3, 2], [1, 3], [1, 2]], # Note two polygons.[[1, 4], [3, 4], [3, 3]]]
plt.figure()# Filled contours using filled=True.cs = ContourSet(plt.gca(), [0, 1, 2], [filled01, filled12], filled=True, cmap=cm.bone)cbar = plt.colorbar(cs)# Contour lines (non-filled).lines = ContourSet(plt.gca(), [0, 1, 2], [lines0, lines1, lines2], cmap=cm.cool,linewidths=3)cbar.add_lines(lines)plt.axis([-0.5, 3.5, -0.5, 4.5])plt.title('User-specified contours')
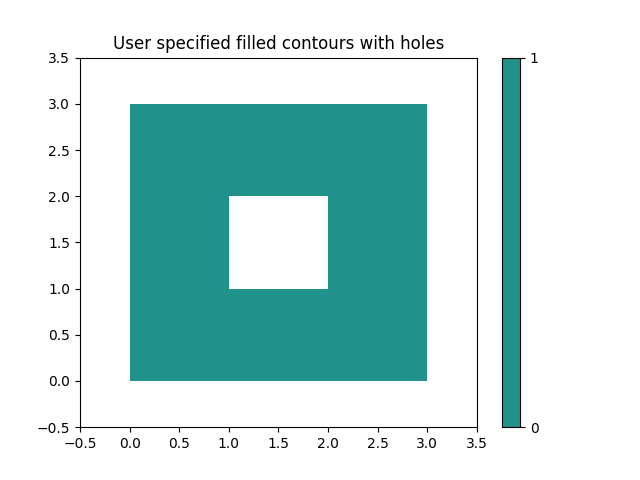
可以在单个多边形顶点列表中指定多个填充轮廓线以及Path类中描述的顶点种类(代码类型)列表。 这对于带孔的多边形特别有用。 代码类型1是MOVETO,2是LINETO。
plt.figure()filled01 = [[[0, 0], [3, 0], [3, 3], [0, 3], [1, 1], [1, 2], [2, 2], [2, 1]]]kinds01 = [[1, 2, 2, 2, 1, 2, 2, 2]]cs = ContourSet(plt.gca(), [0, 1], [filled01], [kinds01], filled=True)cbar = plt.colorbar(cs)plt.axis([-0.5, 3.5, -0.5, 3.5])plt.title('User specified filled contours with holes')plt.show()
下载这个示例

若有收获,就点个赞吧
0 人点赞
