插入定位器演示2
本演示展示了如何通过 zoomed_inset_axes 创建缩放插图。 在第一个子图中,AnchoredSizeBar 显示缩放效果。 在第二个子图中,通过mark_inset 创建与感兴趣区域的连接。
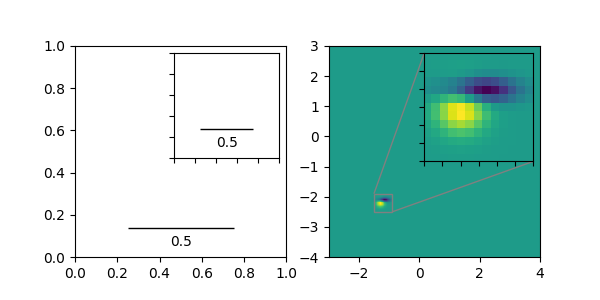
import matplotlib.pyplot as pltfrom mpl_toolkits.axes_grid1.inset_locator import zoomed_inset_axes, mark_insetfrom mpl_toolkits.axes_grid1.anchored_artists import AnchoredSizeBarimport numpy as npdef get_demo_image():from matplotlib.cbook import get_sample_dataimport numpy as npf = get_sample_data("axes_grid/bivariate_normal.npy", asfileobj=False)z = np.load(f)# z is a numpy array of 15x15return z, (-3, 4, -4, 3)fig, (ax, ax2) = plt.subplots(ncols=2, figsize=[6, 3])# First subplot, showing an inset with a size bar.ax.set_aspect(1)axins = zoomed_inset_axes(ax, zoom=0.5, loc='upper right')# fix the number of ticks on the inset axesaxins.yaxis.get_major_locator().set_params(nbins=7)axins.xaxis.get_major_locator().set_params(nbins=7)plt.setp(axins.get_xticklabels(), visible=False)plt.setp(axins.get_yticklabels(), visible=False)def add_sizebar(ax, size):asb = AnchoredSizeBar(ax.transData,size,str(size),loc=8,pad=0.1, borderpad=0.5, sep=5,frameon=False)ax.add_artist(asb)add_sizebar(ax, 0.5)add_sizebar(axins, 0.5)# Second subplot, showing an image with an inset zoom# and a marked insetZ, extent = get_demo_image()Z2 = np.zeros([150, 150], dtype="d")ny, nx = Z.shapeZ2[30:30 + ny, 30:30 + nx] = Z# extent = [-3, 4, -4, 3]ax2.imshow(Z2, extent=extent, interpolation="nearest",origin="lower")axins2 = zoomed_inset_axes(ax2, 6, loc=1) # zoom = 6axins2.imshow(Z2, extent=extent, interpolation="nearest",origin="lower")# sub region of the original imagex1, x2, y1, y2 = -1.5, -0.9, -2.5, -1.9axins2.set_xlim(x1, x2)axins2.set_ylim(y1, y2)# fix the number of ticks on the inset axesaxins2.yaxis.get_major_locator().set_params(nbins=7)axins2.xaxis.get_major_locator().set_params(nbins=7)plt.setp(axins2.get_xticklabels(), visible=False)plt.setp(axins2.get_yticklabels(), visible=False)# draw a bbox of the region of the inset axes in the parent axes and# connecting lines between the bbox and the inset axes areamark_inset(ax2, axins2, loc1=2, loc2=4, fc="none", ec="0.5")plt.show()
下载这个示例

若有收获,就点个赞吧
0 人点赞
