三角形三维填充等高线图
非结构化三角形网格的填充等高线图。
使用的数据与trisurf3d_demo2的第二个图中的数据相同。 tricontour3d_demo显示此示例的未填充版本。
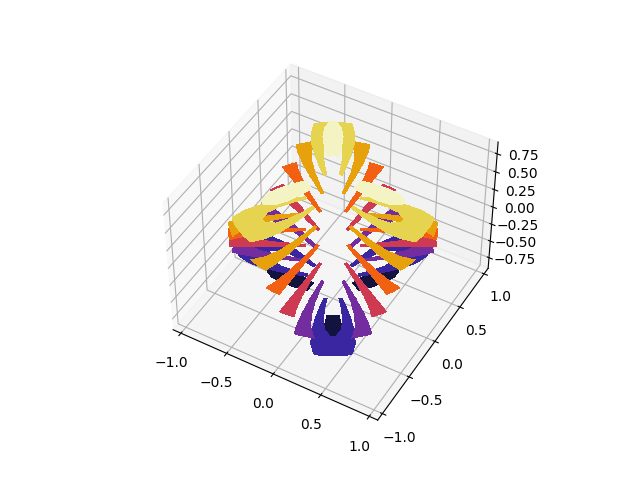
# This import registers the 3D projection, but is otherwise unused.from mpl_toolkits.mplot3d import Axes3D # noqa: F401 unused importimport matplotlib.pyplot as pltimport matplotlib.tri as triimport numpy as np# First create the x, y, z coordinates of the points.n_angles = 48n_radii = 8min_radius = 0.25# Create the mesh in polar coordinates and compute x, y, z.radii = np.linspace(min_radius, 0.95, n_radii)angles = np.linspace(0, 2*np.pi, n_angles, endpoint=False)angles = np.repeat(angles[..., np.newaxis], n_radii, axis=1)angles[:, 1::2] += np.pi/n_anglesx = (radii*np.cos(angles)).flatten()y = (radii*np.sin(angles)).flatten()z = (np.cos(radii)*np.cos(3*angles)).flatten()# Create a custom triangulation.triang = tri.Triangulation(x, y)# Mask off unwanted triangles.triang.set_mask(np.hypot(x[triang.triangles].mean(axis=1),y[triang.triangles].mean(axis=1))< min_radius)fig = plt.figure()ax = fig.gca(projection='3d')ax.tricontourf(triang, z, cmap=plt.cm.CMRmap)# Customize the view angle so it's easier to understand the plot.ax.view_init(elev=45.)plt.show()
下载这个示例

若有收获,就点个赞吧
0 人点赞
