使用ScalarFormat标记格式
该示例显示了ScalarFormatter与不同设置的使用。
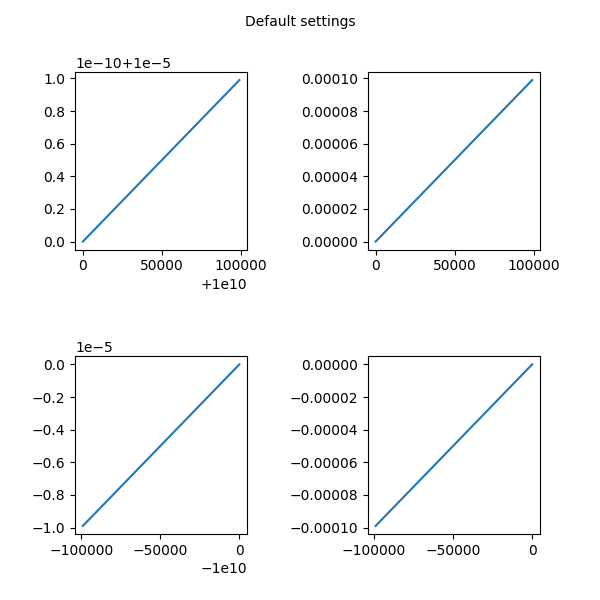
例子1:默认
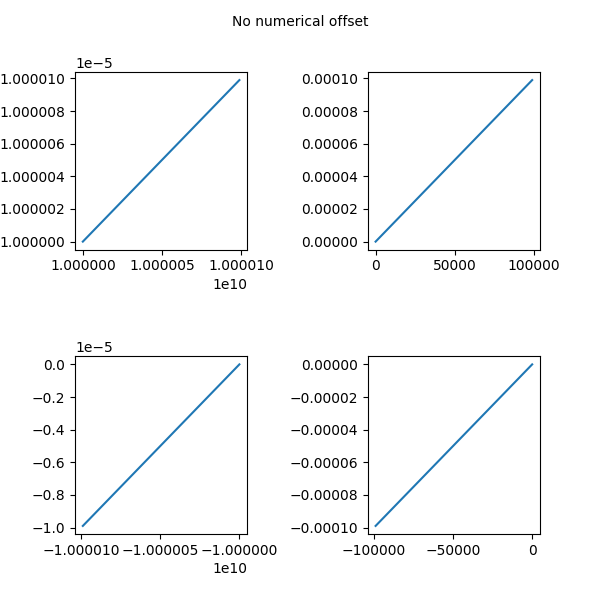
例子2:没有图形偏移
例子3:使用Mathtext
import matplotlib.pyplot as pltimport numpy as npfrom matplotlib.ticker import ScalarFormatter
例子1:
x = np.arange(0, 1, .01)fig, [[ax1, ax2], [ax3, ax4]] = plt.subplots(2, 2, figsize=(6, 6))fig.text(0.5, 0.975, 'The new formatter, default settings',horizontalalignment='center',verticalalignment='top')ax1.plot(x * 1e5 + 1e10, x * 1e-10 + 1e-5)ax1.xaxis.set_major_formatter(ScalarFormatter())ax1.yaxis.set_major_formatter(ScalarFormatter())ax2.plot(x * 1e5, x * 1e-4)ax2.xaxis.set_major_formatter(ScalarFormatter())ax2.yaxis.set_major_formatter(ScalarFormatter())ax3.plot(-x * 1e5 - 1e10, -x * 1e-5 - 1e-10)ax3.xaxis.set_major_formatter(ScalarFormatter())ax3.yaxis.set_major_formatter(ScalarFormatter())ax4.plot(-x * 1e5, -x * 1e-4)ax4.xaxis.set_major_formatter(ScalarFormatter())ax4.yaxis.set_major_formatter(ScalarFormatter())fig.subplots_adjust(wspace=0.7, hspace=0.6)
例子2:
x = np.arange(0, 1, .01)fig, [[ax1, ax2], [ax3, ax4]] = plt.subplots(2, 2, figsize=(6, 6))fig.text(0.5, 0.975, 'The new formatter, no numerical offset',horizontalalignment='center',verticalalignment='top')ax1.plot(x * 1e5 + 1e10, x * 1e-10 + 1e-5)ax1.xaxis.set_major_formatter(ScalarFormatter(useOffset=False))ax1.yaxis.set_major_formatter(ScalarFormatter(useOffset=False))ax2.plot(x * 1e5, x * 1e-4)ax2.xaxis.set_major_formatter(ScalarFormatter(useOffset=False))ax2.yaxis.set_major_formatter(ScalarFormatter(useOffset=False))ax3.plot(-x * 1e5 - 1e10, -x * 1e-5 - 1e-10)ax3.xaxis.set_major_formatter(ScalarFormatter(useOffset=False))ax3.yaxis.set_major_formatter(ScalarFormatter(useOffset=False))ax4.plot(-x * 1e5, -x * 1e-4)ax4.xaxis.set_major_formatter(ScalarFormatter(useOffset=False))ax4.yaxis.set_major_formatter(ScalarFormatter(useOffset=False))fig.subplots_adjust(wspace=0.7, hspace=0.6)
例子3:
x = np.arange(0, 1, .01)fig, [[ax1, ax2], [ax3, ax4]] = plt.subplots(2, 2, figsize=(6, 6))fig.text(0.5, 0.975, 'The new formatter, with mathtext',horizontalalignment='center',verticalalignment='top')ax1.plot(x * 1e5 + 1e10, x * 1e-10 + 1e-5)ax1.xaxis.set_major_formatter(ScalarFormatter(useMathText=True))ax1.yaxis.set_major_formatter(ScalarFormatter(useMathText=True))ax2.plot(x * 1e5, x * 1e-4)ax2.xaxis.set_major_formatter(ScalarFormatter(useMathText=True))ax2.yaxis.set_major_formatter(ScalarFormatter(useMathText=True))ax3.plot(-x * 1e5 - 1e10, -x * 1e-5 - 1e-10)ax3.xaxis.set_major_formatter(ScalarFormatter(useMathText=True))ax3.yaxis.set_major_formatter(ScalarFormatter(useMathText=True))ax4.plot(-x * 1e5, -x * 1e-4)ax4.xaxis.set_major_formatter(ScalarFormatter(useMathText=True))ax4.yaxis.set_major_formatter(ScalarFormatter(useMathText=True))fig.subplots_adjust(wspace=0.7, hspace=0.6)plt.show()

下载这个示例

若有收获,就点个赞吧
0 人点赞
