使用紧凑布局调整轴的大小
tight_layout 尝试调整图中子图的大小,以便轴对象和轴上的标签之间不会重叠。
有关详细信息,请参阅 “约束布局指南”;有关替代方法,请参阅 “严格布局” 指南。
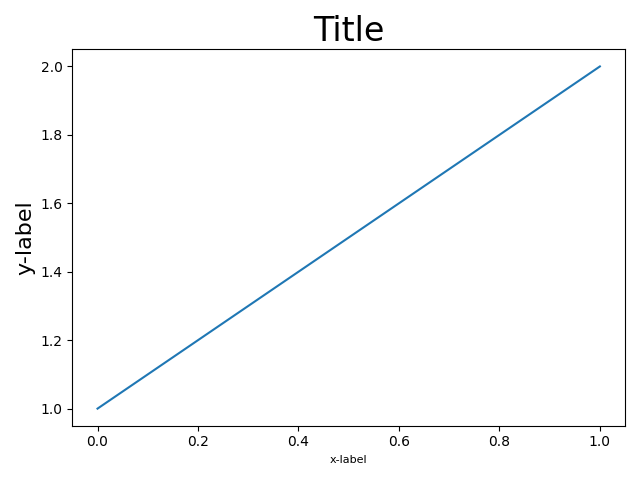
import matplotlib.pyplot as pltimport itertoolsimport warningsfontsizes = itertools.cycle([8, 16, 24, 32])def example_plot(ax):ax.plot([1, 2])ax.set_xlabel('x-label', fontsize=next(fontsizes))ax.set_ylabel('y-label', fontsize=next(fontsizes))ax.set_title('Title', fontsize=next(fontsizes))
fig, ax = plt.subplots()example_plot(ax)plt.tight_layout()
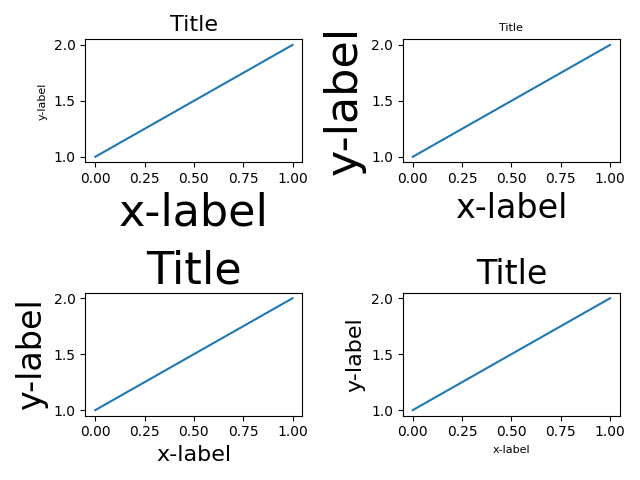
fig, ((ax1, ax2), (ax3, ax4)) = plt.subplots(nrows=2, ncols=2)example_plot(ax1)example_plot(ax2)example_plot(ax3)example_plot(ax4)plt.tight_layout()
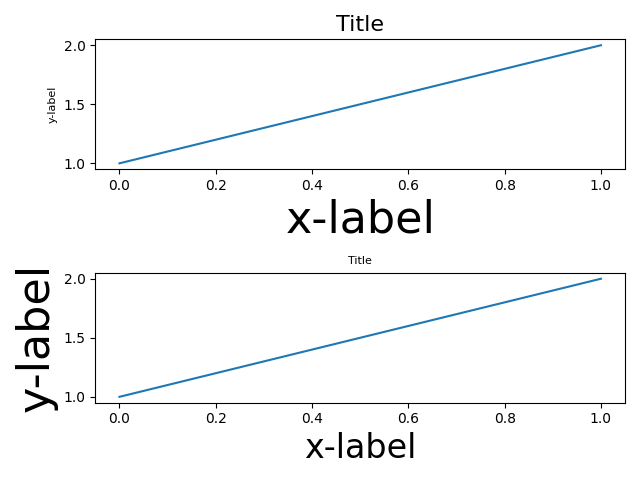
fig, (ax1, ax2) = plt.subplots(nrows=2, ncols=1)example_plot(ax1)example_plot(ax2)plt.tight_layout()
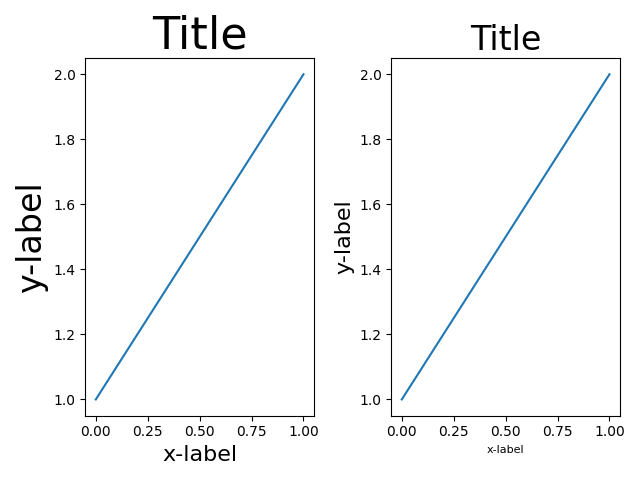
fig, (ax1, ax2) = plt.subplots(nrows=1, ncols=2)example_plot(ax1)example_plot(ax2)plt.tight_layout()
fig, axes = plt.subplots(nrows=3, ncols=3)for row in axes:for ax in row:example_plot(ax)plt.tight_layout()
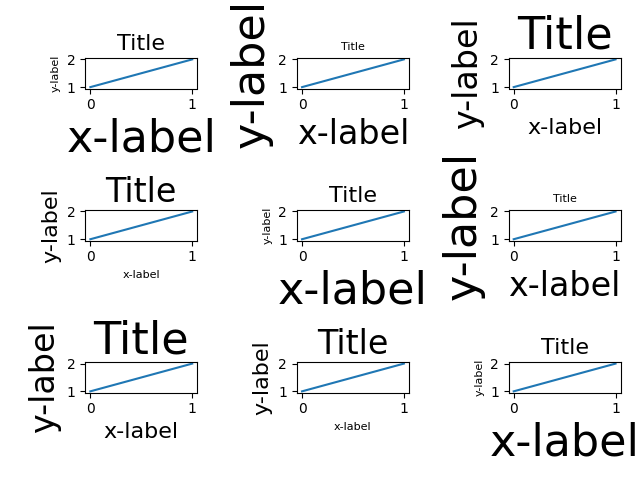
fig = plt.figure()ax1 = plt.subplot(221)ax2 = plt.subplot(223)ax3 = plt.subplot(122)example_plot(ax1)example_plot(ax2)example_plot(ax3)plt.tight_layout()
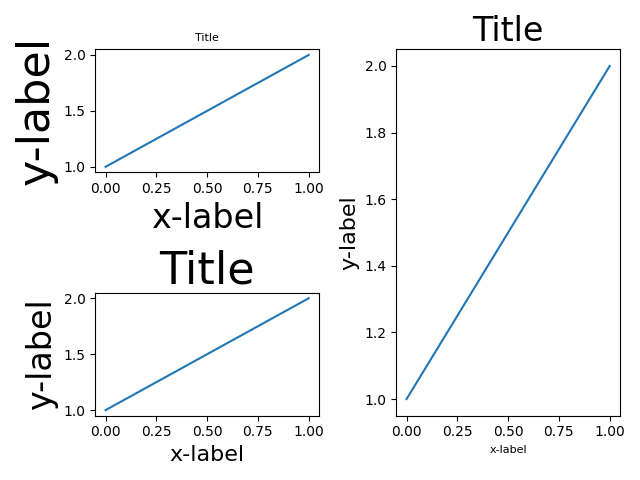
fig = plt.figure()ax1 = plt.subplot2grid((3, 3), (0, 0))ax2 = plt.subplot2grid((3, 3), (0, 1), colspan=2)ax3 = plt.subplot2grid((3, 3), (1, 0), colspan=2, rowspan=2)ax4 = plt.subplot2grid((3, 3), (1, 2), rowspan=2)example_plot(ax1)example_plot(ax2)example_plot(ax3)example_plot(ax4)plt.tight_layout()plt.show()
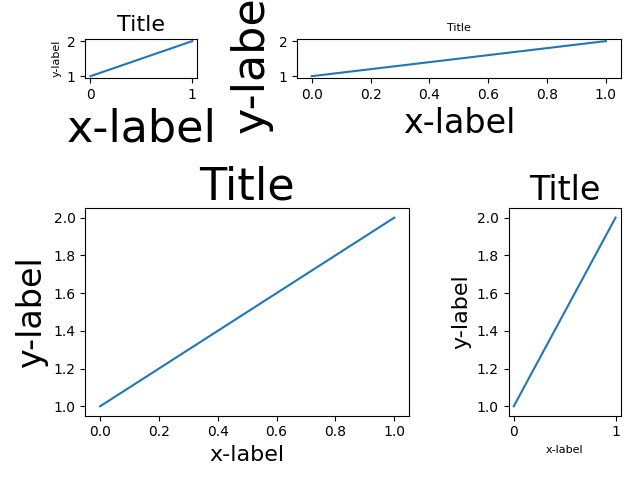
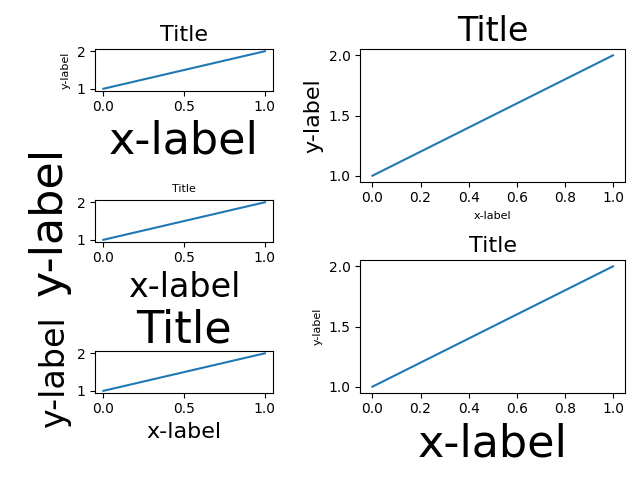
fig = plt.figure()import matplotlib.gridspec as gridspecgs1 = gridspec.GridSpec(3, 1)ax1 = fig.add_subplot(gs1[0])ax2 = fig.add_subplot(gs1[1])ax3 = fig.add_subplot(gs1[2])example_plot(ax1)example_plot(ax2)example_plot(ax3)with warnings.catch_warnings():warnings.simplefilter("ignore", UserWarning)# This raises warnings since tight layout cannot# handle gridspec automatically. We are going to# do that manually so we can filter the warning.gs1.tight_layout(fig, rect=[None, None, 0.45, None])gs2 = gridspec.GridSpec(2, 1)ax4 = fig.add_subplot(gs2[0])ax5 = fig.add_subplot(gs2[1])example_plot(ax4)example_plot(ax5)with warnings.catch_warnings():# This raises warnings since tight layout cannot# handle gridspec automatically. We are going to# do that manually so we can filter the warning.warnings.simplefilter("ignore", UserWarning)gs2.tight_layout(fig, rect=[0.45, None, None, None])# now match the top and bottom of two gridspecs.top = min(gs1.top, gs2.top)bottom = max(gs1.bottom, gs2.bottom)gs1.update(top=top, bottom=bottom)gs2.update(top=top, bottom=bottom)plt.show()
参考
此示例中显示了以下函数和方法的用法:
import matplotlibmatplotlib.pyplot.tight_layoutmatplotlib.figure.Figure.tight_layoutmatplotlib.figure.Figure.add_subplotmatplotlib.pyplot.subplot2gridmatplotlib.gridspec.GridSpec
脚本的总运行时间:(0分1.072秒)
下载这个示例

若有收获,就点个赞吧
0 人点赞
