Spine的放置演示
调整轴Spine的位置和外观。
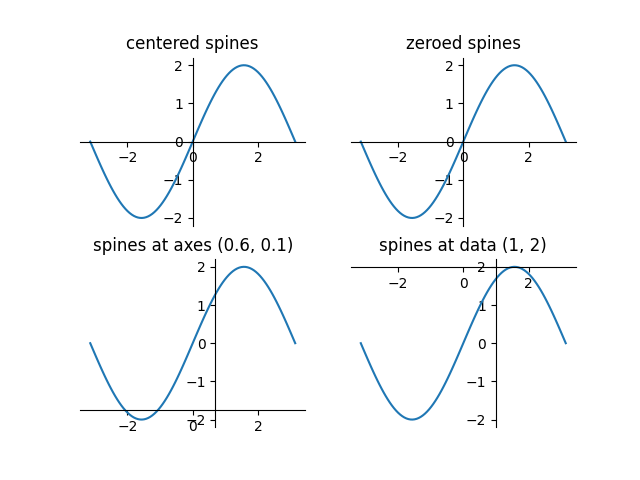
import numpy as npimport matplotlib.pyplot as plt
fig = plt.figure()x = np.linspace(-np.pi, np.pi, 100)y = 2 * np.sin(x)ax = fig.add_subplot(2, 2, 1)ax.set_title('centered spines')ax.plot(x, y)ax.spines['left'].set_position('center')ax.spines['right'].set_color('none')ax.spines['bottom'].set_position('center')ax.spines['top'].set_color('none')ax.spines['left'].set_smart_bounds(True)ax.spines['bottom'].set_smart_bounds(True)ax.xaxis.set_ticks_position('bottom')ax.yaxis.set_ticks_position('left')ax = fig.add_subplot(2, 2, 2)ax.set_title('zeroed spines')ax.plot(x, y)ax.spines['left'].set_position('zero')ax.spines['right'].set_color('none')ax.spines['bottom'].set_position('zero')ax.spines['top'].set_color('none')ax.spines['left'].set_smart_bounds(True)ax.spines['bottom'].set_smart_bounds(True)ax.xaxis.set_ticks_position('bottom')ax.yaxis.set_ticks_position('left')ax = fig.add_subplot(2, 2, 3)ax.set_title('spines at axes (0.6, 0.1)')ax.plot(x, y)ax.spines['left'].set_position(('axes', 0.6))ax.spines['right'].set_color('none')ax.spines['bottom'].set_position(('axes', 0.1))ax.spines['top'].set_color('none')ax.spines['left'].set_smart_bounds(True)ax.spines['bottom'].set_smart_bounds(True)ax.xaxis.set_ticks_position('bottom')ax.yaxis.set_ticks_position('left')ax = fig.add_subplot(2, 2, 4)ax.set_title('spines at data (1, 2)')ax.plot(x, y)ax.spines['left'].set_position(('data', 1))ax.spines['right'].set_color('none')ax.spines['bottom'].set_position(('data', 2))ax.spines['top'].set_color('none')ax.spines['left'].set_smart_bounds(True)ax.spines['bottom'].set_smart_bounds(True)ax.xaxis.set_ticks_position('bottom')ax.yaxis.set_ticks_position('left')
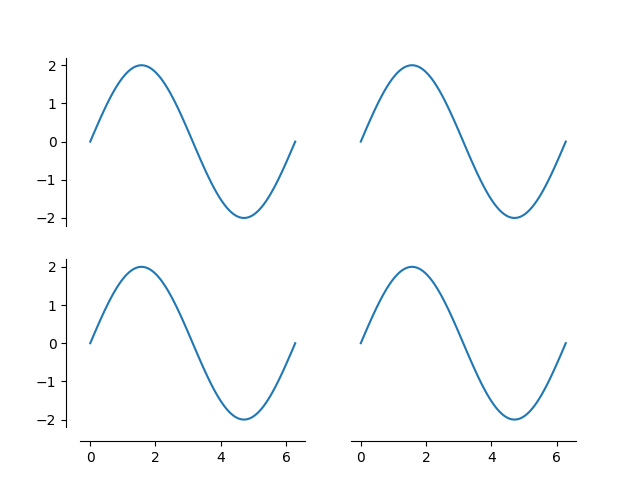
定义一个调整轴Spine位置的方法
def adjust_spines(ax, spines):for loc, spine in ax.spines.items():if loc in spines:spine.set_position(('outward', 10)) # outward by 10 pointsspine.set_smart_bounds(True)else:spine.set_color('none') # don't draw spine# turn off ticks where there is no spineif 'left' in spines:ax.yaxis.set_ticks_position('left')else:# no yaxis ticksax.yaxis.set_ticks([])if 'bottom' in spines:ax.xaxis.set_ticks_position('bottom')else:# no xaxis ticksax.xaxis.set_ticks([])
使用我们的新adjust_spines方法创建另一个图形。
fig = plt.figure()x = np.linspace(0, 2 * np.pi, 100)y = 2 * np.sin(x)ax = fig.add_subplot(2, 2, 1)ax.plot(x, y, clip_on=False)adjust_spines(ax, ['left'])ax = fig.add_subplot(2, 2, 2)ax.plot(x, y, clip_on=False)adjust_spines(ax, [])ax = fig.add_subplot(2, 2, 3)ax.plot(x, y, clip_on=False)adjust_spines(ax, ['left', 'bottom'])ax = fig.add_subplot(2, 2, 4)ax.plot(x, y, clip_on=False)adjust_spines(ax, ['bottom'])plt.show()
下载这个示例

若有收获,就点个赞吧
0 人点赞
