自定义Rc
我不是想在这里做一个好看的人物,而只是为了展示一些动态定制rc params的例子
如果您希望以交互方式工作,并且需要为图形创建不同的默认设置(例如,一组用于发布的默认设置,一组用于交互式探索),您可能希望在自定义模块中定义一些设置默认值的函数, 例如,:
def set_pub():rc('font', weight='bold') # bold fonts are easier to seerc('tick', labelsize=15) # tick labels biggerrc('lines', lw=1, color='k') # thicker black linesrc('grid', c='0.5', ls='-', lw=0.5) # solid gray grid linesrc('savefig', dpi=300) # higher res outputs
然后,当您以交互方式工作时,您只需要:
>>> set_pub()>>> subplot(111)>>> plot([1,2,3])>>> savefig('myfig')>>> rcdefaults() # restore the defaults
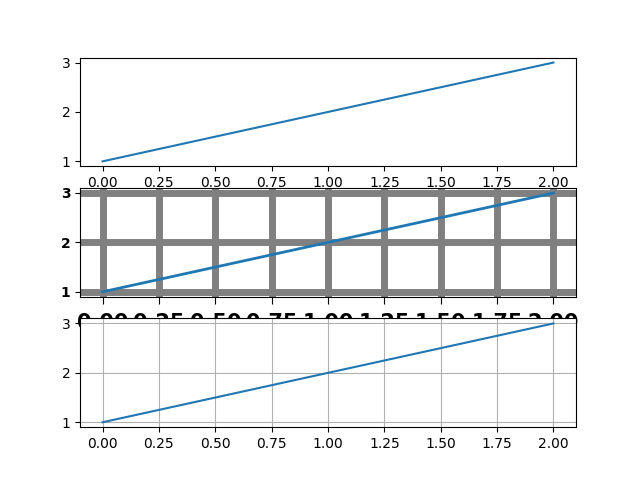
import matplotlib.pyplot as pltplt.subplot(311)plt.plot([1, 2, 3])# the axes attributes need to be set before the call to subplotplt.rc('font', weight='bold')plt.rc('xtick.major', size=5, pad=7)plt.rc('xtick', labelsize=15)# using aliases for color, linestyle and linewidth; gray, solid, thickplt.rc('grid', c='0.5', ls='-', lw=5)plt.rc('lines', lw=2, color='g')plt.subplot(312)plt.plot([1, 2, 3])plt.grid(True)plt.rcdefaults()plt.subplot(313)plt.plot([1, 2, 3])plt.grid(True)plt.show()
下载这个示例

若有收获,就点个赞吧
0 人点赞
