缩放区域嵌入轴
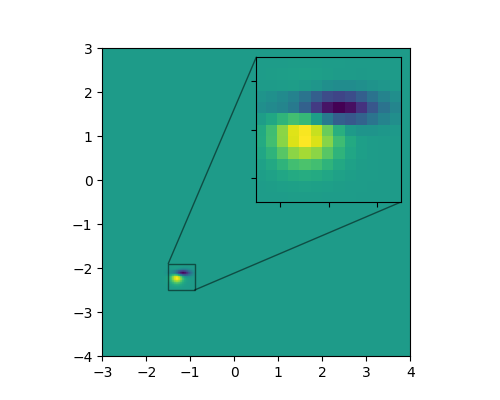
插入轴的示例和显示缩放位置的矩形。
import matplotlib.pyplot as pltimport numpy as npdef get_demo_image():from matplotlib.cbook import get_sample_dataimport numpy as npf = get_sample_data("axes_grid/bivariate_normal.npy", asfileobj=False)z = np.load(f)# z is a numpy array of 15x15return z, (-3, 4, -4, 3)fig, ax = plt.subplots(figsize=[5, 4])# make dataZ, extent = get_demo_image()Z2 = np.zeros([150, 150], dtype="d")ny, nx = Z.shapeZ2[30:30 + ny, 30:30 + nx] = Zax.imshow(Z2, extent=extent, interpolation="nearest",origin="lower")# inset axes....axins = ax.inset_axes([0.5, 0.5, 0.47, 0.47])axins.imshow(Z2, extent=extent, interpolation="nearest",origin="lower")# sub region of the original imagex1, x2, y1, y2 = -1.5, -0.9, -2.5, -1.9axins.set_xlim(x1, x2)axins.set_ylim(y1, y2)axins.set_xticklabels('')axins.set_yticklabels('')ax.indicate_inset_zoom(axins)plt.show()
参考
此示例中显示了以下函数和方法的用法:
import matplotlibmatplotlib.axes.Axes.inset_axesmatplotlib.axes.Axes.indicate_inset_zoommatplotlib.axes.Axes.imshow
下载这个示例

若有收获,就点个赞吧
0 人点赞
