自定义spine边界
使用自定义边界来限制脊椎范围的spine演示。
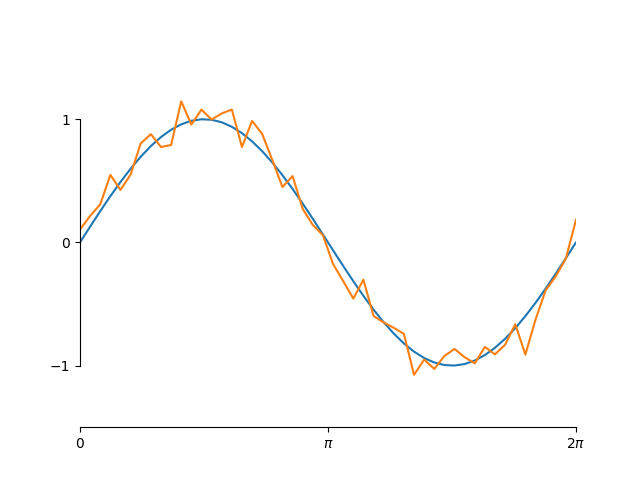
import numpy as npimport matplotlib.pyplot as plt# Fixing random state for reproducibilitynp.random.seed(19680801)x = np.linspace(0, 2*np.pi, 50)y = np.sin(x)y2 = y + 0.1 * np.random.normal(size=x.shape)fig, ax = plt.subplots()ax.plot(x, y, 'k--')ax.plot(x, y2, 'ro')# set ticks and tick labelsax.set_xlim((0, 2*np.pi))ax.set_xticks([0, np.pi, 2*np.pi])ax.set_xticklabels(['0', r'$\pi$', r'2$\pi$'])ax.set_ylim((-1.5, 1.5))ax.set_yticks([-1, 0, 1])# Only draw spine between the y-ticksax.spines['left'].set_bounds(-1, 1)# Hide the right and top spinesax.spines['right'].set_visible(False)ax.spines['top'].set_visible(False)# Only show ticks on the left and bottom spinesax.yaxis.set_ticks_position('left')ax.xaxis.set_ticks_position('bottom')plt.show()
下载这个示例

若有收获,就点个赞吧
0 人点赞
