通过y-value绘制颜色
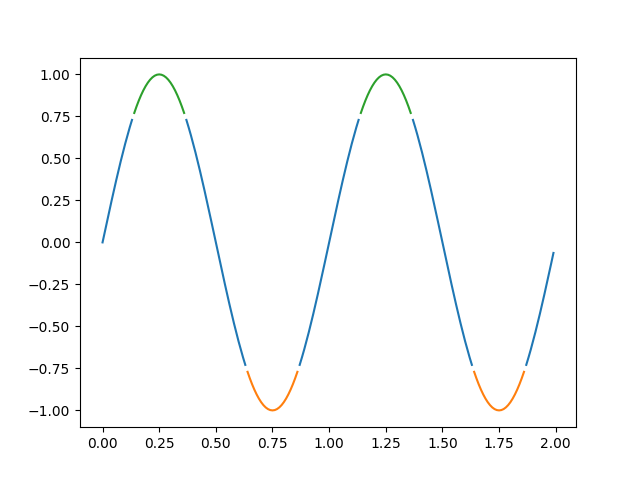
使用掩码数组以y值绘制具有不同颜色的线。
import numpy as npimport matplotlib.pyplot as pltt = np.arange(0.0, 2.0, 0.01)s = np.sin(2 * np.pi * t)upper = 0.77lower = -0.77supper = np.ma.masked_where(s < upper, s)slower = np.ma.masked_where(s > lower, s)smiddle = np.ma.masked_where(np.logical_or(s < lower, s > upper), s)fig, ax = plt.subplots()ax.plot(t, smiddle, t, slower, t, supper)plt.show()
参考
此示例中显示了以下函数,方法,类和模块的使用:
import matplotlibmatplotlib.axes.Axes.plotmatplotlib.pyplot.plot
下载这个示例

若有收获,就点个赞吧
0 人点赞
