动画直方图
使用路径补丁为动画直方图绘制一堆矩形。
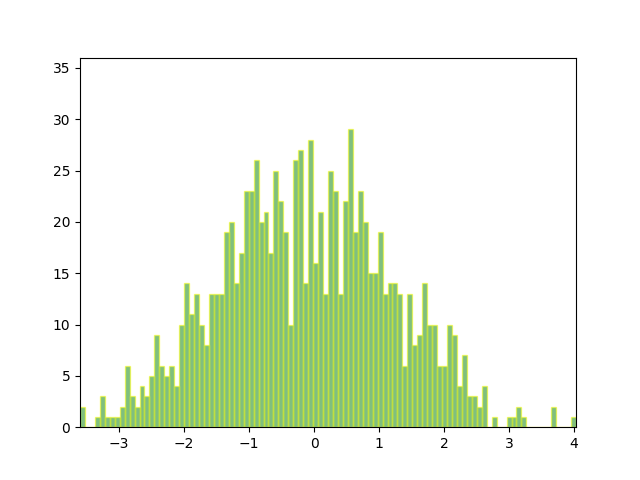
import numpy as npimport matplotlib.pyplot as pltimport matplotlib.patches as patchesimport matplotlib.path as pathimport matplotlib.animation as animation# Fixing random state for reproducibilitynp.random.seed(19680801)# histogram our data with numpydata = np.random.randn(1000)n, bins = np.histogram(data, 100)# get the corners of the rectangles for the histogramleft = np.array(bins[:-1])right = np.array(bins[1:])bottom = np.zeros(len(left))top = bottom + nnrects = len(left)
这里有一个棘手的部分 - 我们必须为每个rect使用 plt.Path.MOVETO,plt.Path.LINETO和plt.Path.CLOSEPOLY设置顶点和路径代码数组。
- 每个矩形我们需要1个
MOVETO,它设置了初始点。 - 我们需要3个
LINETO,它告诉Matplotlib从顶点1到顶点2,v2到v3和v3到v4绘制线。 - 然后我们需要一个
CLOSEPOLY,它告诉Matplotlib从v4到我们的初始顶点(MOVETO顶点)绘制一条线,以便关闭多边形。
注意:CLOSEPOLY的顶点被忽略,但我们仍然需要在verts数组中使用占位符来保持代码与顶点对齐。
nverts = nrects * (1 + 3 + 1)verts = np.zeros((nverts, 2))codes = np.ones(nverts, int) * path.Path.LINETOcodes[0::5] = path.Path.MOVETOcodes[4::5] = path.Path.CLOSEPOLYverts[0::5, 0] = leftverts[0::5, 1] = bottomverts[1::5, 0] = leftverts[1::5, 1] = topverts[2::5, 0] = rightverts[2::5, 1] = topverts[3::5, 0] = rightverts[3::5, 1] = bottom
为了给直方图设置动画,我们需要一个动画函数,它生成一组随机数字并更新直方图顶点的位置(在这种情况下,只有每个矩形的高度)。 补丁最终将成为补丁对象。
patch = Nonedef animate(i):# simulate new data coming indata = np.random.randn(1000)n, bins = np.histogram(data, 100)top = bottom + nverts[1::5, 1] = topverts[2::5, 1] = topreturn [patch, ]
现在我们使用顶点和代码为直方图构建Path和Patch实例。 我们将补丁添加到Axes实例,并使用我们的animate函数设置FuncAnimation。
fig, ax = plt.subplots()barpath = path.Path(verts, codes)patch = patches.PathPatch(barpath, facecolor='green', edgecolor='yellow', alpha=0.5)ax.add_patch(patch)ax.set_xlim(left[0], right[-1])ax.set_ylim(bottom.min(), top.max())ani = animation.FuncAnimation(fig, animate, 100, repeat=False, blit=True)plt.show()
下载这个示例

若有收获,就点个赞吧
0 人点赞
