对齐标签
使用 Figure.align_xlabels 和 Figure.align_ylabels 对齐xlabel和ylabel
Figure.align_labels 包装了这两个函数。
注意,xlabel “XLabel11” 通常更接近x轴,“YLabel1 0” 将更接近其各自轴的y轴。
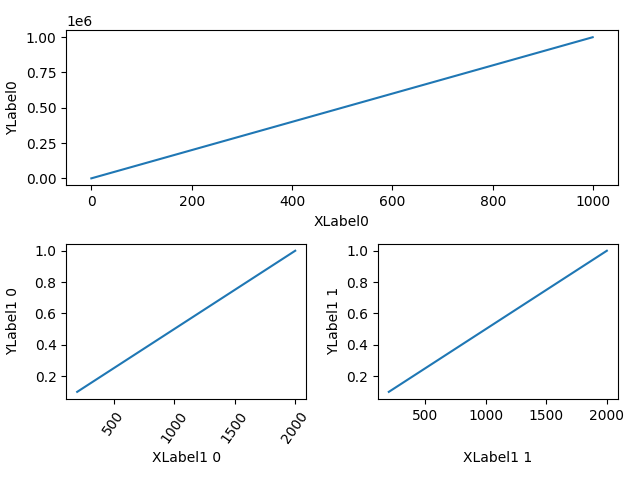
import matplotlib.pyplot as pltimport numpy as npimport matplotlib.gridspec as gridspecfig = plt.figure(tight_layout=True)gs = gridspec.GridSpec(2, 2)ax = fig.add_subplot(gs[0, :])ax.plot(np.arange(0, 1e6, 1000))ax.set_ylabel('YLabel0')ax.set_xlabel('XLabel0')for i in range(2):ax = fig.add_subplot(gs[1, i])ax.plot(np.arange(1., 0., -0.1) * 2000., np.arange(1., 0., -0.1))ax.set_ylabel('YLabel1 %d' % i)ax.set_xlabel('XLabel1 %d' % i)if i == 0:for tick in ax.get_xticklabels():tick.set_rotation(55)fig.align_labels() # same as fig.align_xlabels(); fig.align_ylabels()plt.show()
下载这个示例

若有收获,就点个赞吧
0 人点赞
