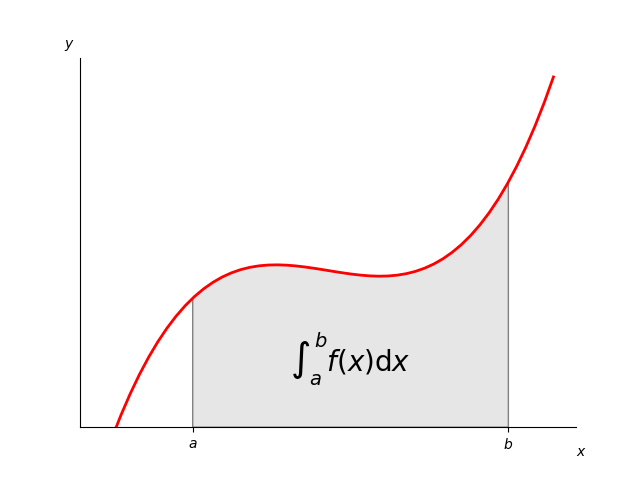
积分作为曲线下面积
虽然这是一个简单的例子,但它展示了一些重要的调整:
- 带有自定义颜色和线宽的简单线条图。
- 使用Polygon补丁创建的阴影区域。
- 带有mathtext渲染的文本标签。
- figtext调用标记x轴和y轴。
- 使用轴刺来隐藏顶部和右侧脊柱。
- 自定义刻度线和标签。
import numpy as npimport matplotlib.pyplot as pltfrom matplotlib.patches import Polygondef func(x):return (x - 3) * (x - 5) * (x - 7) + 85a, b = 2, 9 # integral limitsx = np.linspace(0, 10)y = func(x)fig, ax = plt.subplots()plt.plot(x, y, 'r', linewidth=2)plt.ylim(ymin=0)# Make the shaded regionix = np.linspace(a, b)iy = func(ix)verts = [(a, 0), *zip(ix, iy), (b, 0)]poly = Polygon(verts, facecolor='0.9', edgecolor='0.5')ax.add_patch(poly)plt.text(0.5 * (a + b), 30, r"$\int_a^b f(x)\mathrm{d}x$",horizontalalignment='center', fontsize=20)plt.figtext(0.9, 0.05, '$x$')plt.figtext(0.1, 0.9, '$y$')ax.spines['right'].set_visible(False)ax.spines['top'].set_visible(False)ax.xaxis.set_ticks_position('bottom')ax.set_xticks((a, b))ax.set_xticklabels(('$a$', '$b$'))ax.set_yticks([])plt.show()
下载这个示例

若有收获,就点个赞吧
0 人点赞
