Evans测试
一个模型“Foo”单元类,它根据“单元”支持转换和不同的刻度格式。 这里的“单位”只是一个标量转换因子,但是这个例子表明Matplotlib完全不知道客户端软件包使用哪种单位。
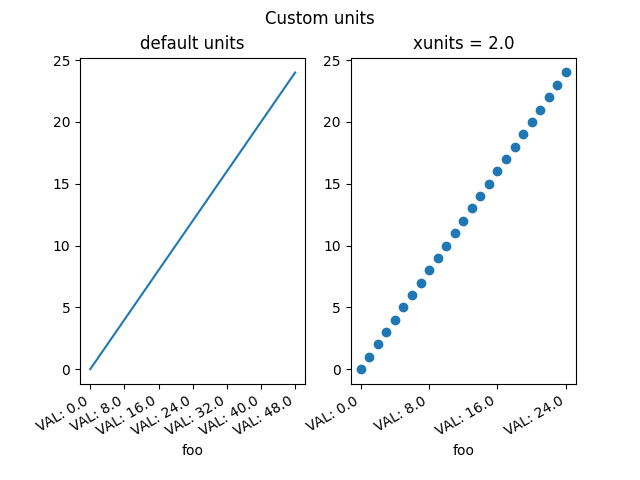
from matplotlib.cbook import iterableimport matplotlib.units as unitsimport matplotlib.ticker as tickerimport matplotlib.pyplot as pltclass Foo(object):def __init__(self, val, unit=1.0):self.unit = unitself._val = val * unitdef value(self, unit):if unit is None:unit = self.unitreturn self._val / unitclass FooConverter(object):@staticmethoddef axisinfo(unit, axis):'return the Foo AxisInfo'if unit == 1.0 or unit == 2.0:return units.AxisInfo(majloc=ticker.IndexLocator(8, 0),majfmt=ticker.FormatStrFormatter("VAL: %s"),label='foo',)else:return None@staticmethoddef convert(obj, unit, axis):"""convert obj using unit. If obj is a sequence, return theconverted sequence"""if units.ConversionInterface.is_numlike(obj):return objif iterable(obj):return [o.value(unit) for o in obj]else:return obj.value(unit)@staticmethoddef default_units(x, axis):'return the default unit for x or None'if iterable(x):for thisx in x:return thisx.unitelse:return x.unitunits.registry[Foo] = FooConverter()# create some Foosx = []for val in range(0, 50, 2):x.append(Foo(val, 1.0))# and some arbitrary y datay = [i for i in range(len(x))]fig, (ax1, ax2) = plt.subplots(1, 2)fig.suptitle("Custom units")fig.subplots_adjust(bottom=0.2)# plot specifying unitsax2.plot(x, y, 'o', xunits=2.0)ax2.set_title("xunits = 2.0")plt.setp(ax2.get_xticklabels(), rotation=30, ha='right')# plot without specifying units; will use the None branch for axisinfoax1.plot(x, y) # uses default unitsax1.set_title('default units')plt.setp(ax1.get_xticklabels(), rotation=30, ha='right')plt.show()
下载这个示例

若有收获,就点个赞吧
0 人点赞
