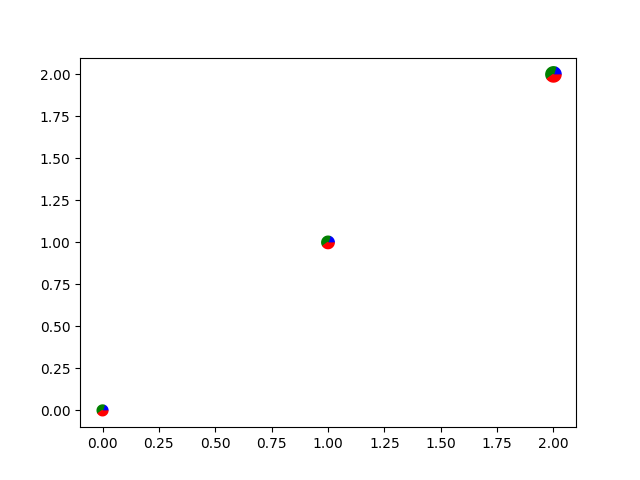
带有饼图标记的散点图
此示例将自定义 ‘饼图’ 作为散点图的标记。
感谢 Manuel Metz 的例子
import numpy as npimport matplotlib.pyplot as plt# first define the ratiosr1 = 0.2 # 20%r2 = r1 + 0.4 # 40%# define some sizes of the scatter markersizes = np.array([60, 80, 120])# calculate the points of the first pie marker## these are just the origin (0,0) +# some points on a circle cos,sinx = [0] + np.cos(np.linspace(0, 2 * np.pi * r1, 10)).tolist()y = [0] + np.sin(np.linspace(0, 2 * np.pi * r1, 10)).tolist()xy1 = np.column_stack([x, y])s1 = np.abs(xy1).max()x = [0] + np.cos(np.linspace(2 * np.pi * r1, 2 * np.pi * r2, 10)).tolist()y = [0] + np.sin(np.linspace(2 * np.pi * r1, 2 * np.pi * r2, 10)).tolist()xy2 = np.column_stack([x, y])s2 = np.abs(xy2).max()x = [0] + np.cos(np.linspace(2 * np.pi * r2, 2 * np.pi, 10)).tolist()y = [0] + np.sin(np.linspace(2 * np.pi * r2, 2 * np.pi, 10)).tolist()xy3 = np.column_stack([x, y])s3 = np.abs(xy3).max()fig, ax = plt.subplots()ax.scatter(range(3), range(3), marker=xy1,s=s1 ** 2 * sizes, facecolor='blue')ax.scatter(range(3), range(3), marker=xy2,s=s2 ** 2 * sizes, facecolor='green')ax.scatter(range(3), range(3), marker=xy3,s=s3 ** 2 * sizes, facecolor='red')plt.show()
参考
本例中显示了下列函数、方法、类和模块的使用:
import matplotlibmatplotlib.axes.Axes.scattermatplotlib.pyplot.scatter
下载这个示例

若有收获,就点个赞吧
0 人点赞
