betweenx填充示例
使用fill_betweenx在两条水平曲线之间着色。
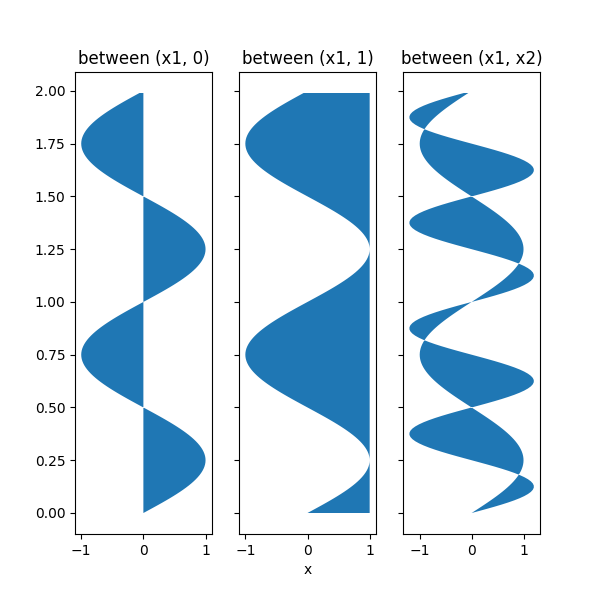
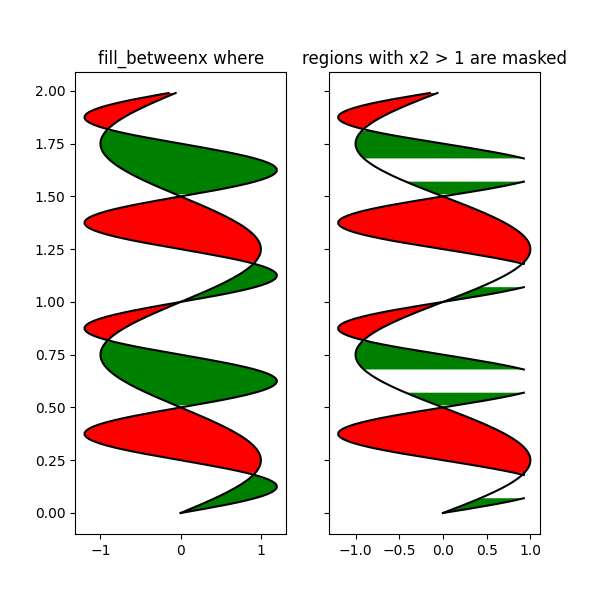
import matplotlib.pyplot as pltimport numpy as npy = np.arange(0.0, 2, 0.01)x1 = np.sin(2 * np.pi * y)x2 = 1.2 * np.sin(4 * np.pi * y)fig, [ax1, ax2, ax3] = plt.subplots(3, 1, sharex=True)ax1.fill_betweenx(y, 0, x1)ax1.set_ylabel('(x1, 0)')ax2.fill_betweenx(y, x1, 1)ax2.set_ylabel('(x1, 1)')ax3.fill_betweenx(y, x1, x2)ax3.set_ylabel('(x1, x2)')ax3.set_xlabel('x')# now fill between x1 and x2 where a logical condition is met. Note# this is different than calling# fill_between(y[where], x1[where], x2[where])# because of edge effects over multiple contiguous regions.fig, [ax, ax1] = plt.subplots(2, 1, sharex=True)ax.plot(x1, y, x2, y, color='black')ax.fill_betweenx(y, x1, x2, where=x2 >= x1, facecolor='green')ax.fill_betweenx(y, x1, x2, where=x2 <= x1, facecolor='red')ax.set_title('fill between where')# Test support for masked arrays.x2 = np.ma.masked_greater(x2, 1.0)ax1.plot(x1, y, x2, y, color='black')ax1.fill_betweenx(y, x1, x2, where=x2 >= x1, facecolor='green')ax1.fill_betweenx(y, x1, x2, where=x2 <= x1, facecolor='red')ax1.set_title('Now regions with x2 > 1 are masked')# This example illustrates a problem; because of the data# gridding, there are undesired unfilled triangles at the crossover# points. A brute-force solution would be to interpolate all# arrays to a very fine grid before plotting.plt.show()
下载这个示例

若有收获,就点个赞吧
0 人点赞
