演示Edge Colorbar
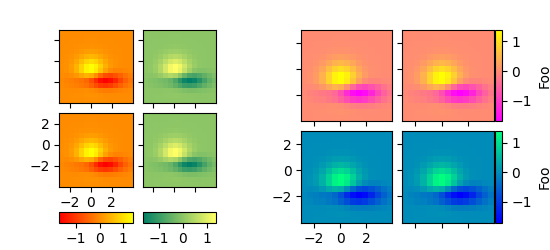
import matplotlib.pyplot as pltfrom mpl_toolkits.axes_grid1 import AxesGriddef get_demo_image():import numpy as npfrom matplotlib.cbook import get_sample_dataf = get_sample_data("axes_grid/bivariate_normal.npy", asfileobj=False)z = np.load(f)# z is a numpy array of 15x15return z, (-3, 4, -4, 3)def demo_bottom_cbar(fig):"""A grid of 2x2 images with a colorbar for each column."""grid = AxesGrid(fig, 121, # similar to subplot(132)nrows_ncols=(2, 2),axes_pad=0.10,share_all=True,label_mode="1",cbar_location="bottom",cbar_mode="edge",cbar_pad=0.25,cbar_size="15%",direction="column")Z, extent = get_demo_image()cmaps = [plt.get_cmap("autumn"), plt.get_cmap("summer")]for i in range(4):im = grid[i].imshow(Z, extent=extent, interpolation="nearest",cmap=cmaps[i//2])if i % 2:cbar = grid.cbar_axes[i//2].colorbar(im)for cax in grid.cbar_axes:cax.toggle_label(True)cax.axis[cax.orientation].set_label("Bar")# This affects all axes as share_all = True.grid.axes_llc.set_xticks([-2, 0, 2])grid.axes_llc.set_yticks([-2, 0, 2])def demo_right_cbar(fig):"""A grid of 2x2 images. Each row has its own colorbar."""grid = AxesGrid(F, 122, # similar to subplot(122)nrows_ncols=(2, 2),axes_pad=0.10,label_mode="1",share_all=True,cbar_location="right",cbar_mode="edge",cbar_size="7%",cbar_pad="2%",)Z, extent = get_demo_image()cmaps = [plt.get_cmap("spring"), plt.get_cmap("winter")]for i in range(4):im = grid[i].imshow(Z, extent=extent, interpolation="nearest",cmap=cmaps[i//2])if i % 2:grid.cbar_axes[i//2].colorbar(im)for cax in grid.cbar_axes:cax.toggle_label(True)cax.axis[cax.orientation].set_label('Foo')# This affects all axes because we set share_all = True.grid.axes_llc.set_xticks([-2, 0, 2])grid.axes_llc.set_yticks([-2, 0, 2])if 1:F = plt.figure(1, (5.5, 2.5))F.subplots_adjust(left=0.05, right=0.93)demo_bottom_cbar(F)demo_right_cbar(F)plt.show()
下载这个示例

若有收获,就点个赞吧
0 人点赞
