在rcParams中实现了对prop_cycle属性markevery的支持
此示例演示了一个发布 #8576 的工作解决方案,通过rcParams为axes.prop_cycle分配提供对markevery属性的完全支持。从markevery演示中使用相同的markevery案例列表。
使用每列的移位正弦曲线渲染绘图,每个正弦曲线都有一个唯一的市场价值。
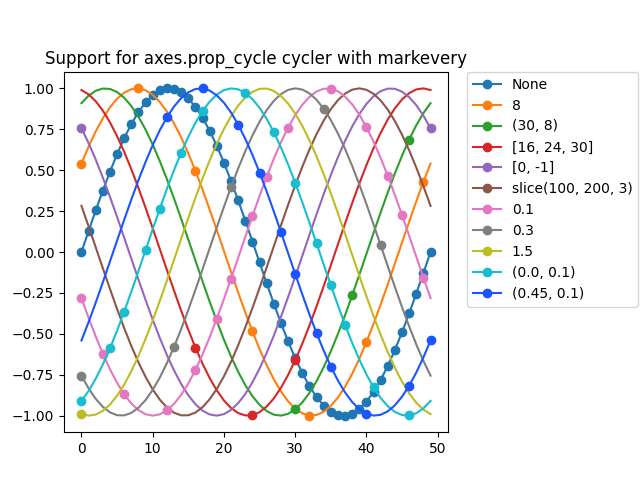
from cycler import cyclerimport numpy as npimport matplotlib as mplimport matplotlib.pyplot as plt# Define a list of markevery cases and color cases to plotcases = [None,8,(30, 8),[16, 24, 30],[0, -1],slice(100, 200, 3),0.1,0.3,1.5,(0.0, 0.1),(0.45, 0.1)]colors = ['#1f77b4','#ff7f0e','#2ca02c','#d62728','#9467bd','#8c564b','#e377c2','#7f7f7f','#bcbd22','#17becf','#1a55FF']# Configure rcParams axes.prop_cycle to simultaneously cycle cases and colors.mpl.rcParams['axes.prop_cycle'] = cycler(markevery=cases, color=colors)# Create data points and offsetsx = np.linspace(0, 2 * np.pi)offsets = np.linspace(0, 2 * np.pi, 11, endpoint=False)yy = np.transpose([np.sin(x + phi) for phi in offsets])# Set the plot curve with markers and a titlefig = plt.figure()ax = fig.add_axes([0.1, 0.1, 0.6, 0.75])for i in range(len(cases)):ax.plot(yy[:, i], marker='o', label=str(cases[i]))ax.legend(bbox_to_anchor=(1.05, 1), loc='upper left', borderaxespad=0.)plt.title('Support for axes.prop_cycle cycler with markevery')plt.show()
下载这个示例

若有收获,就点个赞吧
0 人点赞
