数据浏览器
在多个画布之间连接数据。
此示例介绍了如何与多个画布交互数据。这样,您可以选择并突出显示一个轴上的点,并在另一个轴上生成该点的数据。
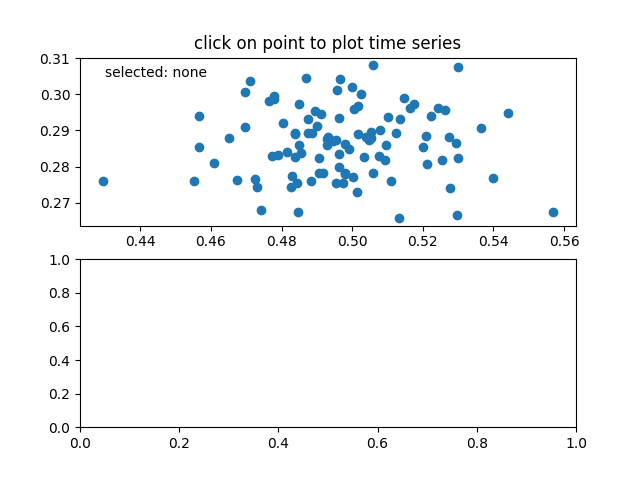
import numpy as npclass PointBrowser(object):"""Click on a point to select and highlight it -- the data thatgenerated the point will be shown in the lower axes. Use the 'n'and 'p' keys to browse through the next and previous points"""def __init__(self):self.lastind = 0self.text = ax.text(0.05, 0.95, 'selected: none',transform=ax.transAxes, va='top')self.selected, = ax.plot([xs[0]], [ys[0]], 'o', ms=12, alpha=0.4,color='yellow', visible=False)def onpress(self, event):if self.lastind is None:returnif event.key not in ('n', 'p'):returnif event.key == 'n':inc = 1else:inc = -1self.lastind += incself.lastind = np.clip(self.lastind, 0, len(xs) - 1)self.update()def onpick(self, event):if event.artist != line:return TrueN = len(event.ind)if not N:return True# the click locationsx = event.mouseevent.xdatay = event.mouseevent.ydatadistances = np.hypot(x - xs[event.ind], y - ys[event.ind])indmin = distances.argmin()dataind = event.ind[indmin]self.lastind = dataindself.update()def update(self):if self.lastind is None:returndataind = self.lastindax2.cla()ax2.plot(X[dataind])ax2.text(0.05, 0.9, 'mu=%1.3f\nsigma=%1.3f' % (xs[dataind], ys[dataind]),transform=ax2.transAxes, va='top')ax2.set_ylim(-0.5, 1.5)self.selected.set_visible(True)self.selected.set_data(xs[dataind], ys[dataind])self.text.set_text('selected: %d' % dataind)fig.canvas.draw()if __name__ == '__main__':import matplotlib.pyplot as plt# Fixing random state for reproducibilitynp.random.seed(19680801)X = np.random.rand(100, 200)xs = np.mean(X, axis=1)ys = np.std(X, axis=1)fig, (ax, ax2) = plt.subplots(2, 1)ax.set_title('click on point to plot time series')line, = ax.plot(xs, ys, 'o', picker=5) # 5 points tolerancebrowser = PointBrowser()fig.canvas.mpl_connect('pick_event', browser.onpick)fig.canvas.mpl_connect('key_press_event', browser.onpress)plt.show()
下载这个示例

若有收获,就点个赞吧
0 人点赞
