自定义Ticker1
新的自动收报机代码旨在明确支持用户自定义滴答。matplotlib.ticker 的文档详细介绍了此过程。 该代码定义了许多预设代码,但主要设计为用户可扩展。
在此示例中,用户定义的函数用于格式化y轴上数百万美元的刻度。
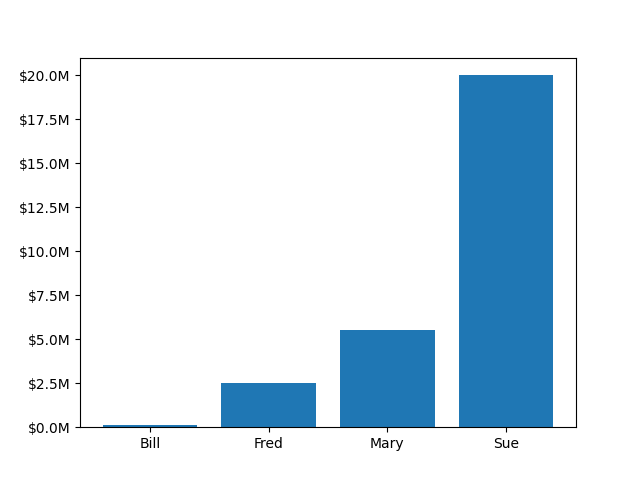
from matplotlib.ticker import FuncFormatterimport matplotlib.pyplot as pltimport numpy as npx = np.arange(4)money = [1.5e5, 2.5e6, 5.5e6, 2.0e7]def millions(x, pos):'The two args are the value and tick position'return '$%1.1fM' % (x * 1e-6)formatter = FuncFormatter(millions)fig, ax = plt.subplots()ax.yaxis.set_major_formatter(formatter)plt.bar(x, money)plt.xticks(x, ('Bill', 'Fred', 'Mary', 'Sue'))plt.show()
下载这个示例

若有收获,就点个赞吧
0 人点赞
