简单的轴线2
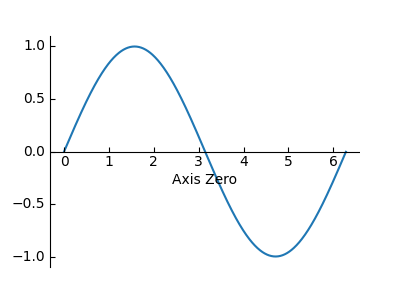
import matplotlib.pyplot as pltfrom mpl_toolkits.axisartist.axislines import SubplotZeroimport numpy as npfig = plt.figure(1, (4, 3))# a subplot with two additional axis, "xzero" and "yzero". "xzero" is# y=0 line, and "yzero" is x=0 line.ax = SubplotZero(fig, 1, 1, 1)fig.add_subplot(ax)# make xzero axis (horizontal axis line through y=0) visible.ax.axis["xzero"].set_visible(True)ax.axis["xzero"].label.set_text("Axis Zero")# make other axis (bottom, top, right) invisible.for n in ["bottom", "top", "right"]:ax.axis[n].set_visible(False)xx = np.arange(0, 2*np.pi, 0.01)ax.plot(xx, np.sin(xx))plt.show()
下载这个示例

若有收获,就点个赞吧
0 人点赞
