简单的 RGB
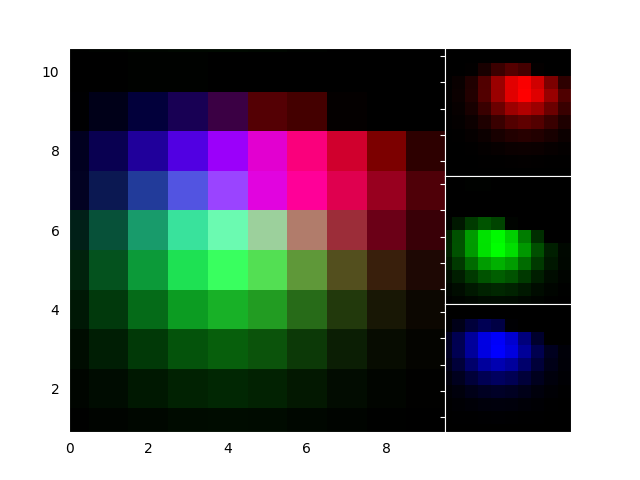
import matplotlib.pyplot as pltfrom mpl_toolkits.axes_grid1.axes_rgb import RGBAxesdef get_demo_image():import numpy as npfrom matplotlib.cbook import get_sample_dataf = get_sample_data("axes_grid/bivariate_normal.npy", asfileobj=False)z = np.load(f)# z is a numpy array of 15x15return z, (-3, 4, -4, 3)def get_rgb():Z, extent = get_demo_image()Z[Z < 0] = 0.Z = Z / Z.max()R = Z[:13, :13]G = Z[2:, 2:]B = Z[:13, 2:]return R, G, Bfig = plt.figure(1)ax = RGBAxes(fig, [0.1, 0.1, 0.8, 0.8])r, g, b = get_rgb()kwargs = dict(origin="lower", interpolation="nearest")ax.imshow_rgb(r, g, b, **kwargs)ax.RGB.set_xlim(0., 9.5)ax.RGB.set_ylim(0.9, 10.6)plt.show()
下载这个示例

若有收获,就点个赞吧
0 人点赞
