日期刻度标签
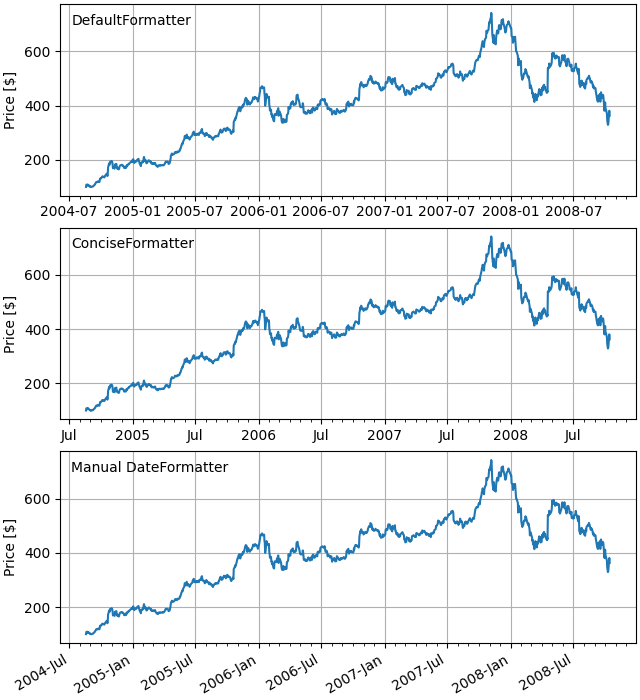
演示如何使用日期刻度定位器和格式化程序在matplotlib中创建日期图。有关控制主要和次要刻度的更多信息,请参阅major_minor_demo1.py
所有matplotlib日期绘图都是通过将日期实例转换为自 0001-01-01 00:00:00 UTC 加上一天后的天数(由于历史原因)来完成的。 转换,刻度定位和格式化是在幕后完成的,因此这对您来说是最透明的。 日期模块提供了几个转换器函数 matplotlib.dates.date2num 和matplotlib.dates.num2date。这些可以在datetime.datetime 对象和 numpy.datetime64 对象之间进行转换。
import numpy as npimport matplotlib.pyplot as pltimport matplotlib.dates as mdatesimport matplotlib.cbook as cbookyears = mdates.YearLocator() # every yearmonths = mdates.MonthLocator() # every monthyearsFmt = mdates.DateFormatter('%Y')# Load a numpy record array from yahoo csv data with fields date, open, close,# volume, adj_close from the mpl-data/example directory. The record array# stores the date as an np.datetime64 with a day unit ('D') in the date column.with cbook.get_sample_data('goog.npz') as datafile:r = np.load(datafile)['price_data'].view(np.recarray)fig, ax = plt.subplots()ax.plot(r.date, r.adj_close)# format the ticksax.xaxis.set_major_locator(years)ax.xaxis.set_major_formatter(yearsFmt)ax.xaxis.set_minor_locator(months)# round to nearest years...datemin = np.datetime64(r.date[0], 'Y')datemax = np.datetime64(r.date[-1], 'Y') + np.timedelta64(1, 'Y')ax.set_xlim(datemin, datemax)# format the coords message boxdef price(x):return '$%1.2f' % xax.format_xdata = mdates.DateFormatter('%Y-%m-%d')ax.format_ydata = priceax.grid(True)# rotates and right aligns the x labels, and moves the bottom of the# axes up to make room for themfig.autofmt_xdate()plt.show()
下载这个示例

若有收获,就点个赞吧
0 人点赞
