多重图像
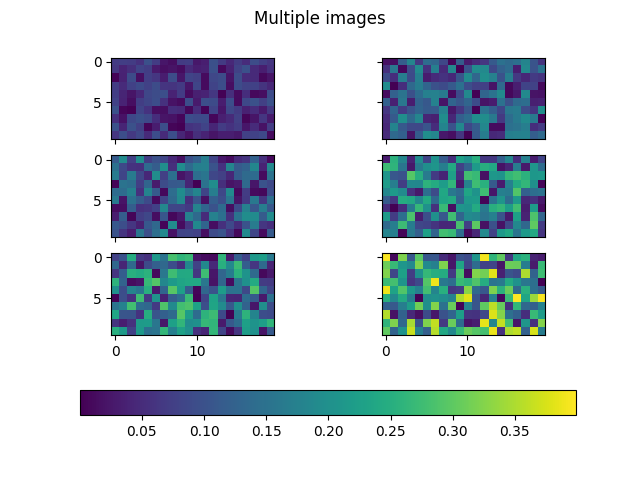
用单一的彩色地图、标准和颜色条制作一组图像。
from matplotlib import colorsimport matplotlib.pyplot as pltimport numpy as npnp.random.seed(19680801)Nr = 3Nc = 2cmap = "cool"fig, axs = plt.subplots(Nr, Nc)fig.suptitle('Multiple images')images = []for i in range(Nr):for j in range(Nc):# Generate data with a range that varies from one plot to the next.data = ((1 + i + j) / 10) * np.random.rand(10, 20) * 1e-6images.append(axs[i, j].imshow(data, cmap=cmap))axs[i, j].label_outer()# Find the min and max of all colors for use in setting the color scale.vmin = min(image.get_array().min() for image in images)vmax = max(image.get_array().max() for image in images)norm = colors.Normalize(vmin=vmin, vmax=vmax)for im in images:im.set_norm(norm)fig.colorbar(images[0], ax=axs, orientation='horizontal', fraction=.1)# Make images respond to changes in the norm of other images (e.g. via the# "edit axis, curves and images parameters" GUI on Qt), but be careful not to# recurse infinitely!def update(changed_image):for im in images:if (changed_image.get_cmap() != im.get_cmap()or changed_image.get_clim() != im.get_clim()):im.set_cmap(changed_image.get_cmap())im.set_clim(changed_image.get_clim())for im in images:im.callbacksSM.connect('changed', update)plt.show()
参考
本例中显示了以下函数、方法和类的使用:
import matplotlibmatplotlib.axes.Axes.imshowmatplotlib.pyplot.imshowmatplotlib.figure.Figure.colorbarmatplotlib.pyplot.colorbarmatplotlib.colors.Normalizematplotlib.cm.ScalarMappable.set_cmapmatplotlib.cm.ScalarMappable.set_normmatplotlib.cm.ScalarMappable.set_climmatplotlib.cbook.CallbackRegistry.connect
下载这个示例

若有收获,就点个赞吧
0 人点赞
