Trifinder 事件演示
显示使用TriFinder对象的示例。当鼠标在三角测量上移动时,光标下方的三角形将突出显示,三角形的索引将显示在图表标题中。
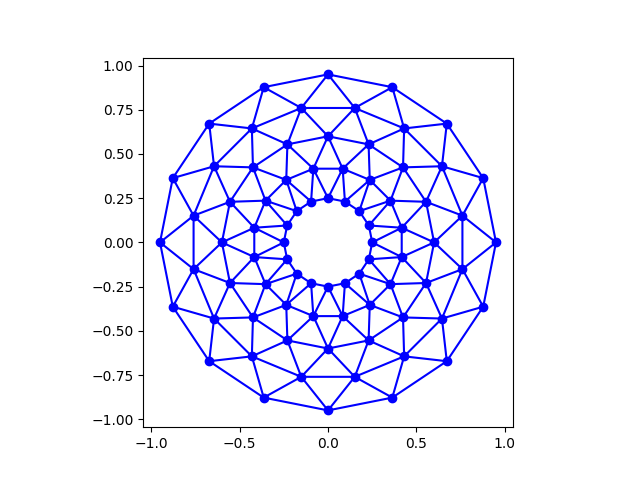
import matplotlib.pyplot as pltfrom matplotlib.tri import Triangulationfrom matplotlib.patches import Polygonimport numpy as npdef update_polygon(tri):if tri == -1:points = [0, 0, 0]else:points = triang.triangles[tri]xs = triang.x[points]ys = triang.y[points]polygon.set_xy(np.column_stack([xs, ys]))def motion_notify(event):if event.inaxes is None:tri = -1else:tri = trifinder(event.xdata, event.ydata)update_polygon(tri)plt.title('In triangle %i' % tri)event.canvas.draw()# Create a Triangulation.n_angles = 16n_radii = 5min_radius = 0.25radii = np.linspace(min_radius, 0.95, n_radii)angles = np.linspace(0, 2 * np.pi, n_angles, endpoint=False)angles = np.repeat(angles[..., np.newaxis], n_radii, axis=1)angles[:, 1::2] += np.pi / n_anglesx = (radii*np.cos(angles)).flatten()y = (radii*np.sin(angles)).flatten()triang = Triangulation(x, y)triang.set_mask(np.hypot(x[triang.triangles].mean(axis=1),y[triang.triangles].mean(axis=1))< min_radius)# Use the triangulation's default TriFinder object.trifinder = triang.get_trifinder()# Setup plot and callbacks.plt.subplot(111, aspect='equal')plt.triplot(triang, 'bo-')polygon = Polygon([[0, 0], [0, 0]], facecolor='y') # dummy data for xs,ysupdate_polygon(-1)plt.gca().add_patch(polygon)plt.gcf().canvas.mpl_connect('motion_notify_event', motion_notify)plt.show()
下载这个示例

若有收获,就点个赞吧
0 人点赞
