堆栈图示例
如何使用Matplotlib创建堆栈图。
通过将不同的数据集垂直地绘制在彼此之上而不是彼此重叠来生成堆积图。下面我们展示一些使用Matplotlib实现此目的的示例。
import numpy as npimport matplotlib.pyplot as pltx = [1, 2, 3, 4, 5]y1 = [1, 1, 2, 3, 5]y2 = [0, 4, 2, 6, 8]y3 = [1, 3, 5, 7, 9]y = np.vstack([y1, y2, y3])labels = ["Fibonacci ", "Evens", "Odds"]fig, ax = plt.subplots()ax.stackplot(x, y1, y2, y3, labels=labels)ax.legend(loc='upper left')plt.show()fig, ax = plt.subplots()ax.stackplot(x, y)plt.show()
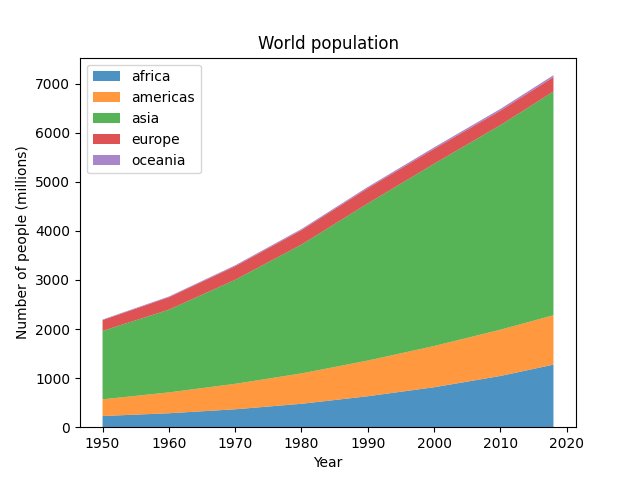
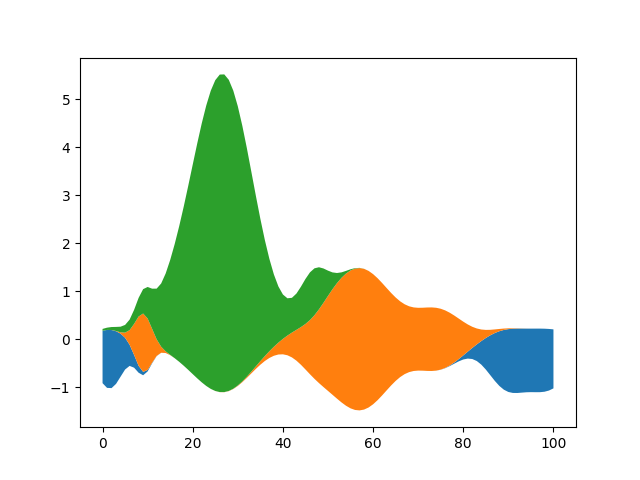
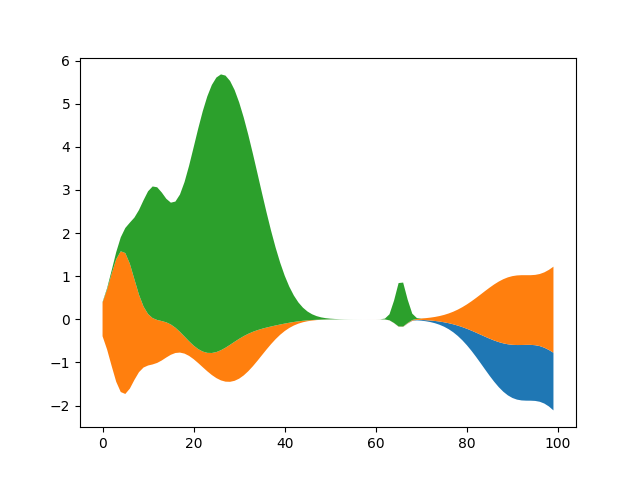
这里我们展示了使用stackplot制作流图的示例。
def layers(n, m):"""Return *n* random Gaussian mixtures, each of length *m*."""def bump(a):x = 1 / (.1 + np.random.random())y = 2 * np.random.random() - .5z = 10 / (.1 + np.random.random())for i in range(m):w = (i / m - y) * za[i] += x * np.exp(-w * w)a = np.zeros((m, n))for i in range(n):for j in range(5):bump(a[:, i])return ad = layers(3, 100)fig, ax = plt.subplots()ax.stackplot(range(100), d.T, baseline='wiggle')plt.show()
下载这个示例

若有收获,就点个赞吧
0 人点赞
