阶梯图示例
阶梯图例子:
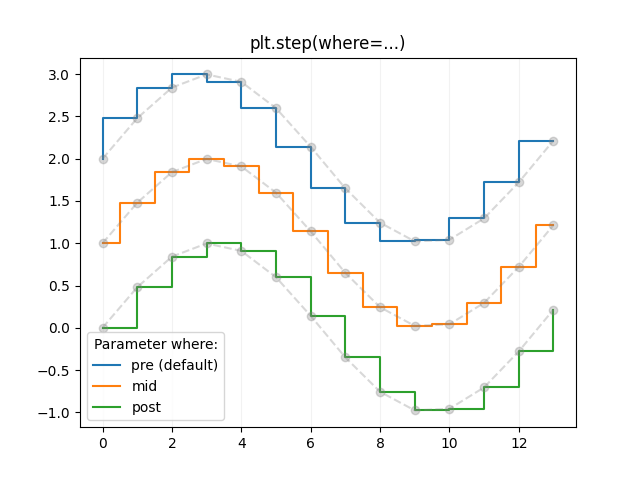
import numpy as npfrom numpy import maimport matplotlib.pyplot as pltx = np.arange(1, 7, 0.4)y0 = np.sin(x)y = y0.copy() + 2.5plt.step(x, y, label='pre (default)')y -= 0.5plt.step(x, y, where='mid', label='mid')y -= 0.5plt.step(x, y, where='post', label='post')y = ma.masked_where((y0 > -0.15) & (y0 < 0.15), y - 0.5)plt.step(x, y, label='masked (pre)')plt.legend()plt.xlim(0, 7)plt.ylim(-0.5, 4)plt.show()
下载这个示例

若有收获,就点个赞吧
0 人点赞
