撰写自定义图例
Composing custom legends piece-by-piece.
注意:
For more information on creating and customizing legends, see the following pages:
有时您不希望与已绘制的数据明确关联的图例。例如,假设您已绘制了10行,但不希望每个行都显示图例项。如果您只是绘制线条并调用ax.legend(),您将获得以下内容:
# sphinx_gallery_thumbnail_number = 2from matplotlib import rcParams, cyclerimport matplotlib.pyplot as pltimport numpy as np# Fixing random state for reproducibilitynp.random.seed(19680801)N = 10data = [np.logspace(0, 1, 100) + np.random.randn(100) + ii for ii in range(N)]data = np.array(data).Tcmap = plt.cm.coolwarmrcParams['axes.prop_cycle'] = cycler(color=cmap(np.linspace(0, 1, N)))fig, ax = plt.subplots()lines = ax.plot(data)ax.legend(lines)
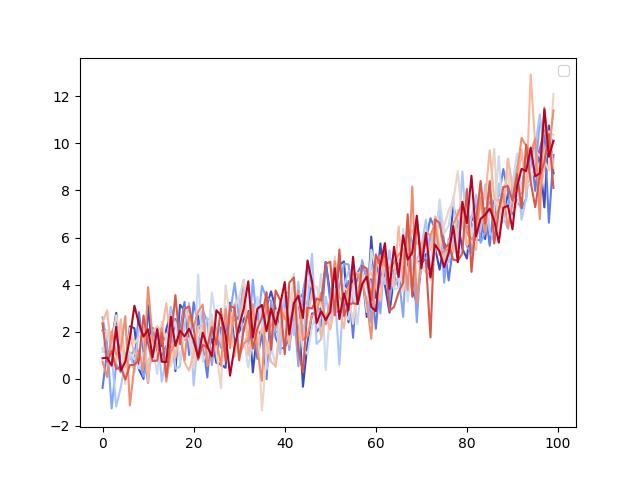
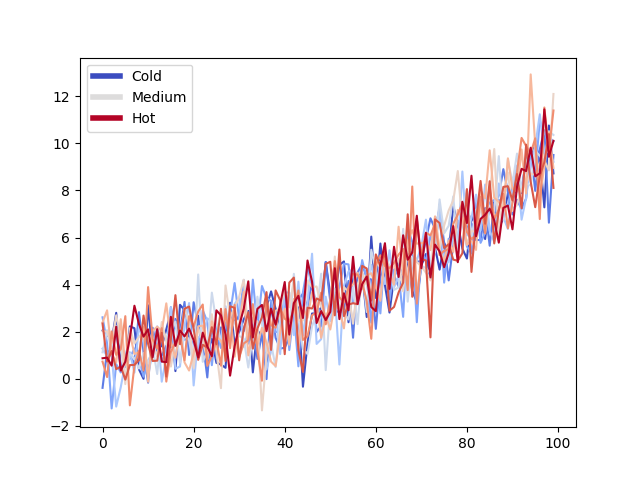
请注意,每行创建一个图例项。在这种情况下,我们可以使用未明确绑定到绘制数据的Matplotlib对象组成图例。例如:
from matplotlib.lines import Line2Dcustom_lines = [Line2D([0], [0], color=cmap(0.), lw=4),Line2D([0], [0], color=cmap(.5), lw=4),Line2D([0], [0], color=cmap(1.), lw=4)]fig, ax = plt.subplots()lines = ax.plot(data)ax.legend(custom_lines, ['Cold', 'Medium', 'Hot'])
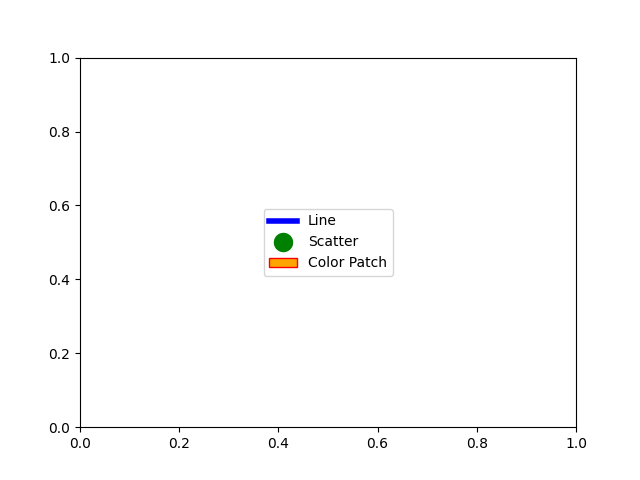
还有许多其他Matplotlib对象可以这种方式使用。 在下面的代码中,我们列出了一些常见的代码。
from matplotlib.patches import Patchfrom matplotlib.lines import Line2Dlegend_elements = [Line2D([0], [0], color='b', lw=4, label='Line'),Line2D([0], [0], marker='o', color='w', label='Scatter',markerfacecolor='g', markersize=15),Patch(facecolor='orange', edgecolor='r',label='Color Patch')]# Create the figurefig, ax = plt.subplots()ax.legend(handles=legend_elements, loc='center')plt.show()
下载这个示例

若有收获,就点个赞吧
0 人点赞
