自动调整子图
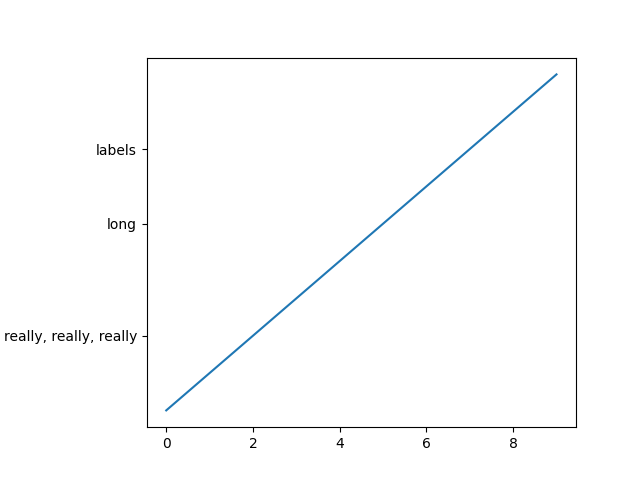
自动调整子图参数。 此示例显示了一种使用draw_event上的回调从ticklabels范围确定subplot参数的方法。
请注意,使用tight_layout或 constrained_layout 可以实现类似的结果; 此示例显示了如何自定义子图参数调整。
import matplotlib.pyplot as pltimport matplotlib.transforms as mtransformsfig, ax = plt.subplots()ax.plot(range(10))ax.set_yticks((2,5,7))labels = ax.set_yticklabels(('really, really, really', 'long', 'labels'))def on_draw(event):bboxes = []for label in labels:bbox = label.get_window_extent()# the figure transform goes from relative coords->pixels and we# want the inverse of thatbboxi = bbox.inverse_transformed(fig.transFigure)bboxes.append(bboxi)# this is the bbox that bounds all the bboxes, again in relative# figure coordsbbox = mtransforms.Bbox.union(bboxes)if fig.subplotpars.left < bbox.width:# we need to move it overfig.subplots_adjust(left=1.1*bbox.width) # pad a littlefig.canvas.draw()return Falsefig.canvas.mpl_connect('draw_event', on_draw)plt.show()
参考
此示例中显示了以下函数,方法,类和模块的使用:
import matplotlibmatplotlib.artist.Artist.get_window_extentmatplotlib.transforms.Bboxmatplotlib.transforms.Bbox.inverse_transformedmatplotlib.transforms.Bbox.unionmatplotlib.figure.Figure.subplots_adjustmatplotlib.figure.SubplotParamsmatplotlib.backend_bases.FigureCanvasBase.mpl_connect
下载这个示例

若有收获,就点个赞吧
0 人点赞
