演示轴 RGB
RGBAxes显示RGB合成图像。
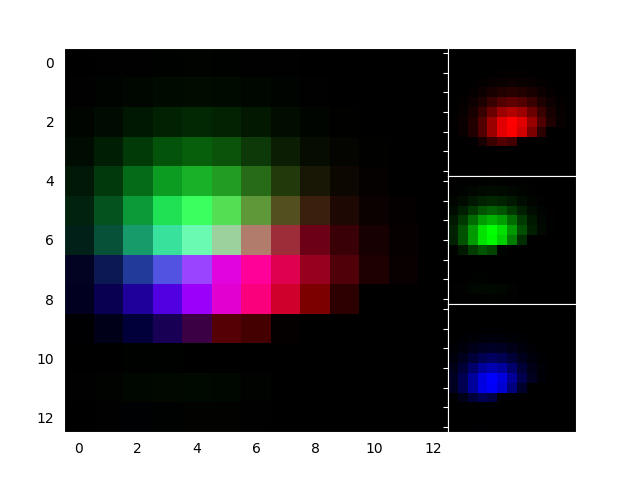
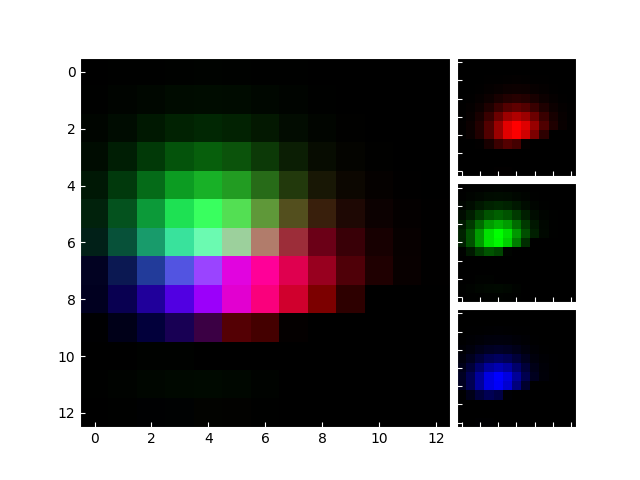
import numpy as npimport matplotlib.pyplot as pltfrom mpl_toolkits.axes_grid1.axes_rgb import make_rgb_axes, RGBAxesdef get_demo_image():from matplotlib.cbook import get_sample_dataf = get_sample_data("axes_grid/bivariate_normal.npy", asfileobj=False)z = np.load(f)# z is a numpy array of 15x15return z, (-3, 4, -4, 3)def get_rgb():Z, extent = get_demo_image()Z[Z < 0] = 0.Z = Z/Z.max()R = Z[:13, :13]G = Z[2:, 2:]B = Z[:13, 2:]return R, G, Bdef make_cube(r, g, b):ny, nx = r.shapeR = np.zeros([ny, nx, 3], dtype="d")R[:, :, 0] = rG = np.zeros_like(R)G[:, :, 1] = gB = np.zeros_like(R)B[:, :, 2] = bRGB = R + G + Breturn R, G, B, RGBdef demo_rgb():fig, ax = plt.subplots()ax_r, ax_g, ax_b = make_rgb_axes(ax, pad=0.02)#fig.add_axes(ax_r)#fig.add_axes(ax_g)#fig.add_axes(ax_b)r, g, b = get_rgb()im_r, im_g, im_b, im_rgb = make_cube(r, g, b)kwargs = dict(origin="lower", interpolation="nearest")ax.imshow(im_rgb, **kwargs)ax_r.imshow(im_r, **kwargs)ax_g.imshow(im_g, **kwargs)ax_b.imshow(im_b, **kwargs)def demo_rgb2():fig = plt.figure(2)ax = RGBAxes(fig, [0.1, 0.1, 0.8, 0.8], pad=0.0)#fig.add_axes(ax)#ax.add_RGB_to_figure()r, g, b = get_rgb()kwargs = dict(origin="lower", interpolation="nearest")ax.imshow_rgb(r, g, b, **kwargs)ax.RGB.set_xlim(0., 9.5)ax.RGB.set_ylim(0.9, 10.6)for ax1 in [ax.RGB, ax.R, ax.G, ax.B]:for sp1 in ax1.spines.values():sp1.set_color("w")for tick in ax1.xaxis.get_major_ticks() + ax1.yaxis.get_major_ticks():tick.tick1line.set_mec("w")tick.tick2line.set_mec("w")return axdemo_rgb()ax = demo_rgb2()plt.show()
下载这个示例

若有收获,就点个赞吧
0 人点赞
