带有单位的注释
该示例说明了如何使用厘米级绘图创建文本和箭头注释。
此示例需要 basic_units.py
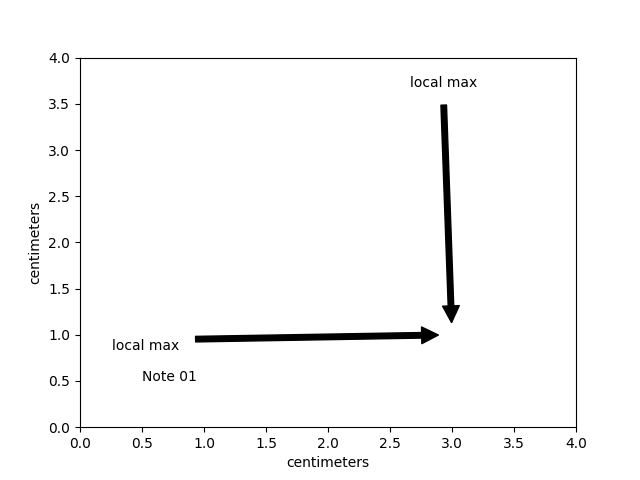
import matplotlib.pyplot as pltfrom basic_units import cmfig, ax = plt.subplots()ax.annotate("Note 01", [0.5*cm, 0.5*cm])# xy and text both unitizedax.annotate('local max', xy=(3*cm, 1*cm), xycoords='data',xytext=(0.8*cm, 0.95*cm), textcoords='data',arrowprops=dict(facecolor='black', shrink=0.05),horizontalalignment='right', verticalalignment='top')# mixing units w/ nonunitsax.annotate('local max', xy=(3*cm, 1*cm), xycoords='data',xytext=(0.8, 0.95), textcoords='axes fraction',arrowprops=dict(facecolor='black', shrink=0.05),horizontalalignment='right', verticalalignment='top')ax.set_xlim(0*cm, 4*cm)ax.set_ylim(0*cm, 4*cm)plt.show()
下载这个示例

若有收获,就点个赞吧
0 人点赞
