注释Simple01
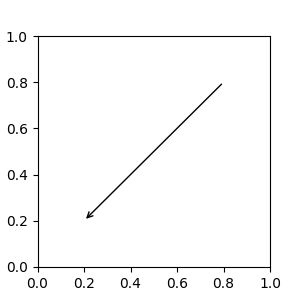
import matplotlib.pyplot as pltfig, ax = plt.subplots(figsize=(3, 3))ax.annotate("",xy=(0.2, 0.2), xycoords='data',xytext=(0.8, 0.8), textcoords='data',arrowprops=dict(arrowstyle="->",connectionstyle="arc3"),)plt.show()
下载这个示例

若有收获,就点个赞吧
0 人点赞
